Technical Analysis of IHYF 2024-05-10
Overview:
In analyzing the technical indicators for IHYF over the last 5 days, we will delve into the trend, momentum, volatility, and volume indicators to provide a comprehensive outlook on the possible stock price movement. By examining these key aspects, we aim to offer valuable insights and predictions for the upcoming days.
Trend Analysis:
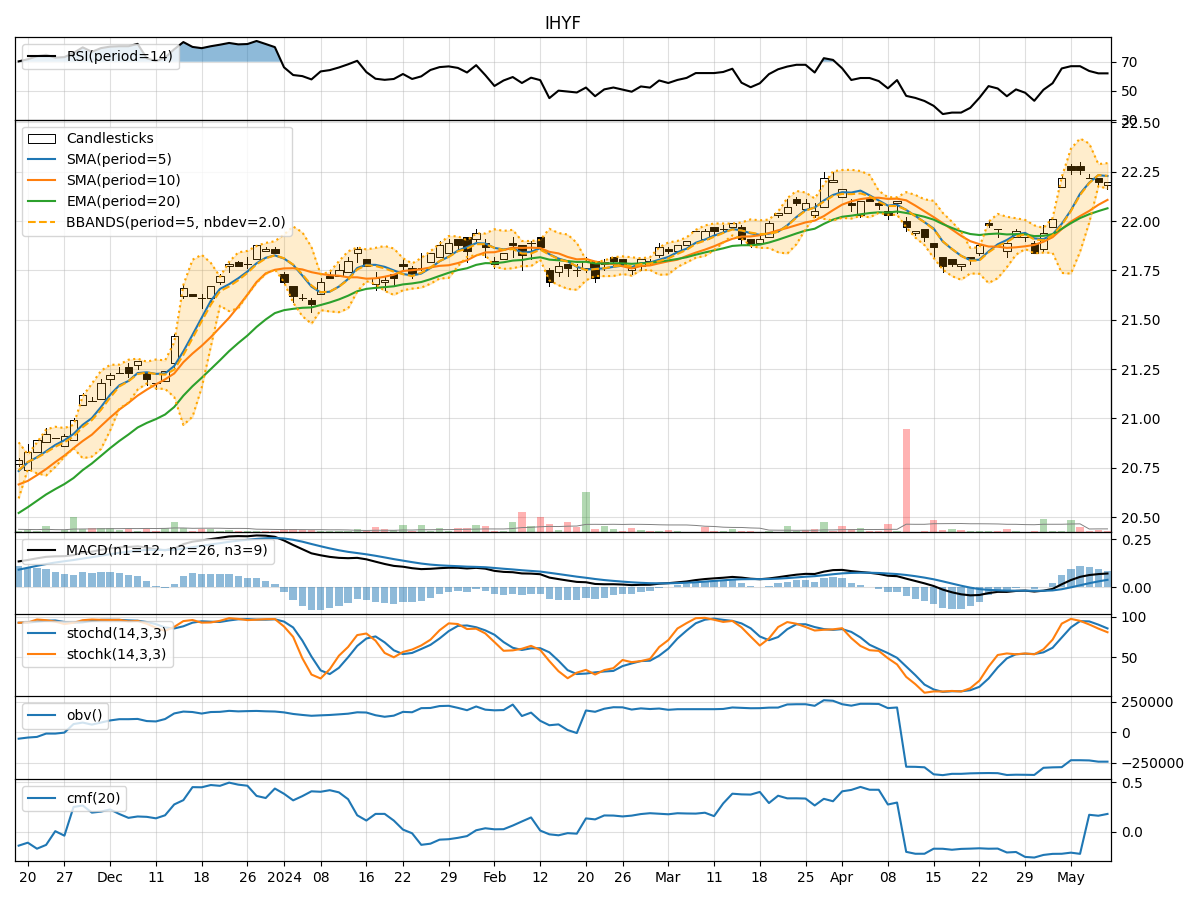
- Moving Averages (MA): The 5-day Moving Average (MA) has been consistently above the Simple Moving Average (SMA) and Exponential Moving Average (EMA), indicating a bullish trend.
- MACD: The MACD line has been consistently above the signal line, with both lines showing an upward trend, suggesting bullish momentum.
Momentum Analysis:
- RSI: The Relative Strength Index (RSI) has been in the overbought territory, indicating a strong bullish momentum.
- Stochastic Oscillator: Both %K and %D have been decreasing, moving towards the oversold region, signaling a potential reversal in momentum.
Volatility Analysis:
- Bollinger Bands (BB): The stock price has been trading within the Bollinger Bands, with the bands narrowing, suggesting a period of consolidation.
Volume Analysis:
- On-Balance Volume (OBV): The OBV has been decreasing, indicating a divergence between price and volume, which could signal a potential trend reversal.
- Chaikin Money Flow (CMF): The CMF has been fluctuating around the zero line, indicating a balance between buying and selling pressure.
Key Observations:
- The trend indicators suggest a strong bullish sentiment in the short term.
- Momentum indicators show signs of potential exhaustion in the bullish momentum.
- Volatility indicators point towards a period of consolidation.
- Volume indicators indicate a divergence between price and volume, signaling a potential reversal.
Conclusion:
Based on the analysis of the technical indicators, the stock price of IHYF is likely to experience a short-term consolidation phase with a potential reversal in momentum from bullish to sideways or even bearish. Traders should exercise caution and consider taking profits or implementing risk management strategies in anticipation of a possible trend reversal. It is advisable to closely monitor the price action and key support/resistance levels for further confirmation of the anticipated price movement.