Technical Analysis of IJAN 2024-05-10
Overview:
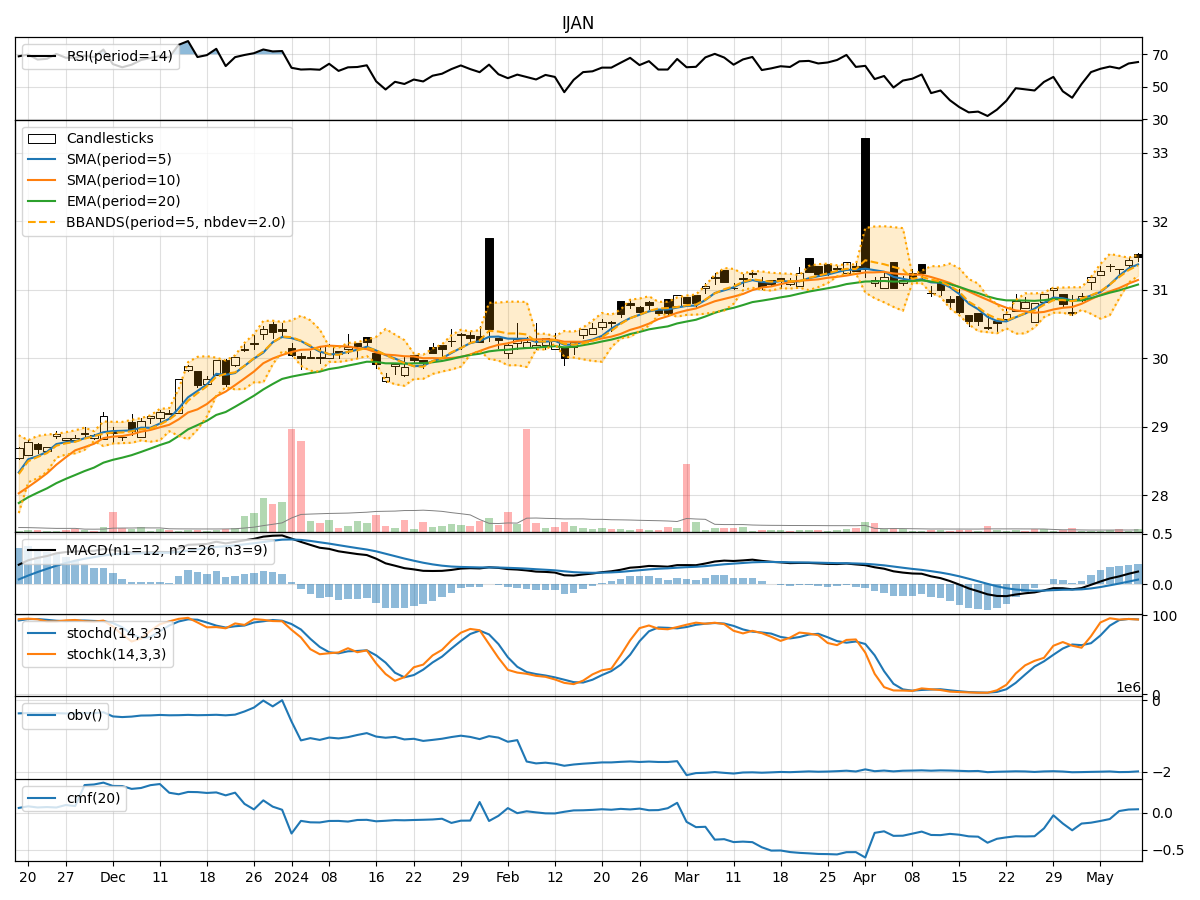
In analyzing the technical indicators for IJAN stock over the last 5 days, we will delve into the trend, momentum, volatility, and volume indicators to provide a comprehensive outlook on the possible stock price movement in the coming days.
Trend Indicators:
- Moving Averages (MA): The 5-day Moving Average (MA) has been consistently above the Simple Moving Average (SMA) and Exponential Moving Average (EMA), indicating a bullish trend.
- MACD: The MACD line has been consistently above the signal line, with both lines showing an upward trend, suggesting bullish momentum.
- MACD Histogram: The MACD Histogram has been increasing over the past 5 days, indicating strengthening bullish momentum.
Momentum Indicators:
- RSI: The Relative Strength Index (RSI) has been in the overbought territory, indicating a strong bullish momentum.
- Stochastic Oscillator: Both %K and %D lines of the Stochastic Oscillator have been in the overbought zone, suggesting a strong bullish sentiment.
- Williams %R: The Williams %R has been consistently in the oversold region, indicating a strong bullish momentum.
Volatility Indicators:
- Bollinger Bands (BB): The stock price has been trading within the upper Bollinger Band (BBU), indicating an increased volatility but also a potential bullish sentiment.
- Bollinger Band Width: The Bollinger Band Width has been narrowing, suggesting a potential decrease in volatility and a possible consolidation phase.
Volume Indicators:
- On-Balance Volume (OBV): The OBV has been fluctuating but overall showing a slight decrease, indicating some distribution happening in the stock.
- Chaikin Money Flow (CMF): The CMF has been positive, indicating buying pressure in the stock.
Key Observations and Opinions:
- Trend: The trend indicators suggest a strong bullish sentiment in the stock.
- Momentum: Momentum indicators also confirm the bullish momentum in the stock.
- Volatility: Volatility indicators show a mix of increased volatility and potential consolidation.
- Volume: Volume indicators indicate some distribution but overall positive buying pressure.
Conclusion:
Based on the analysis of the technical indicators, the stock of IJAN is currently in a strong bullish trend with positive momentum and increased volatility. The volume indicators also suggest positive buying pressure. Therefore, the next few days are likely to see the stock price continuing its upward movement. Traders and investors may consider buying opportunities in the stock based on the current technical outlook.