Technical Analysis of IJJ 2024-05-10
Overview:
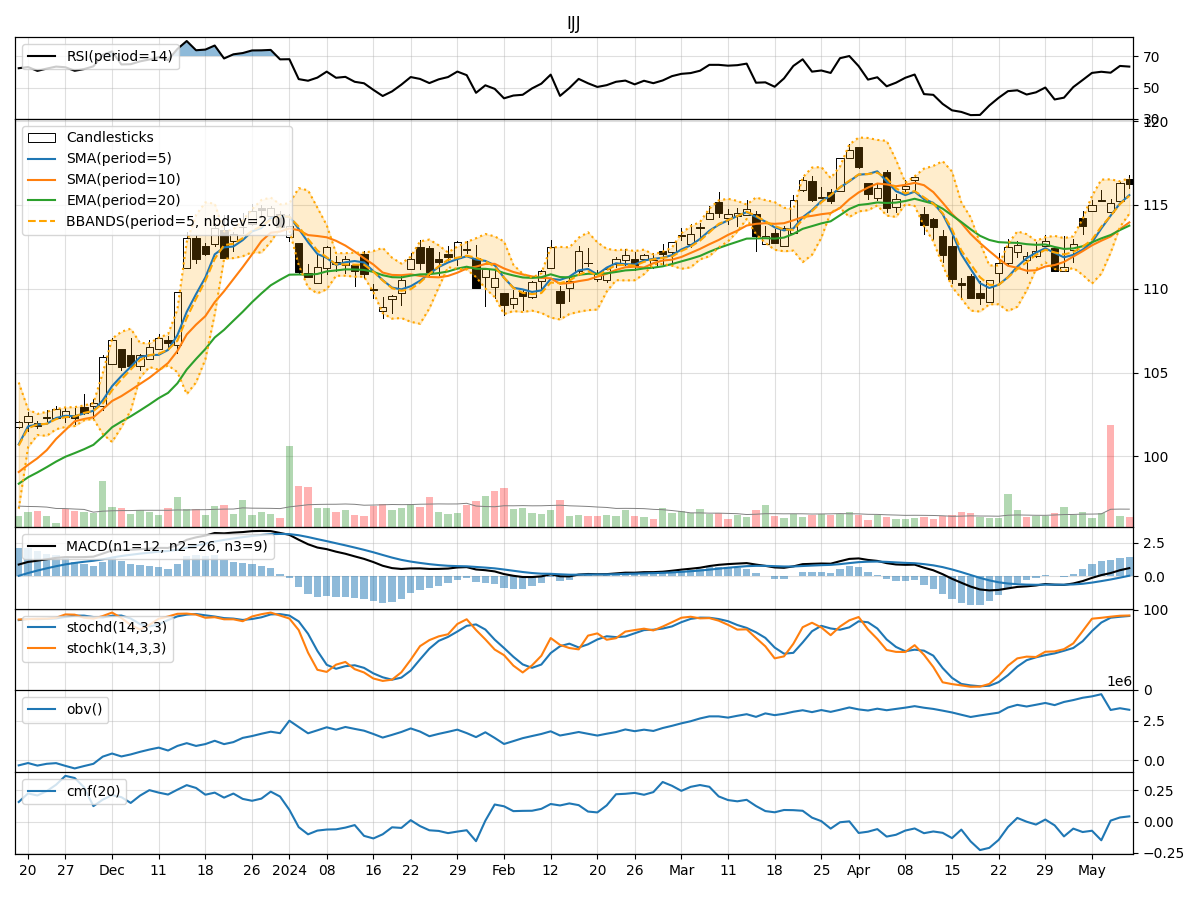
In analyzing the technical indicators for IJJ over the last 5 days, we will delve into the trend, momentum, volatility, and volume indicators to provide a comprehensive outlook on the possible stock price movement in the coming days.
Trend Indicators:
- Moving Averages (MA): The 5-day Moving Average has been consistently above the longer-term Simple Moving Average (SMA) and Exponential Moving Average (EMA), indicating a bullish trend.
- MACD: The MACD line has been consistently above the signal line, with both lines showing an upward trend, suggesting bullish momentum.
- MACD Histogram: The MACD Histogram has been increasing over the past 5 days, indicating strengthening bullish momentum.
Momentum Indicators:
- RSI: The Relative Strength Index (RSI) has been in the neutral to slightly overbought territory, indicating potential room for further upside.
- Stochastic Oscillator: Both %K and %D lines of the Stochastic Oscillator have been in the overbought zone, suggesting a strong bullish momentum.
- Williams %R: The Williams %R has been in the oversold territory, indicating a potential reversal to the upside.
Volatility Indicators:
- Bollinger Bands: The stock price has been trading within the Bollinger Bands, with the bands narrowing, suggesting a period of consolidation.
- Bollinger %B: The %B indicator has been hovering around the midline, indicating a balanced market sentiment.
Volume Indicators:
- On-Balance Volume (OBV): The OBV has shown mixed signals, with fluctuations in volume accumulation, indicating indecision in the market.
- Chaikin Money Flow (CMF): The CMF has been slightly positive, suggesting some buying pressure in the market.
Conclusion:
Based on the analysis of the technical indicators, the overall outlook for IJJ in the next few days is bullish. The trend indicators, momentum indicators, and volatility indicators all point towards a potential continuation of the current uptrend. However, the mixed signals from the volume indicators suggest some caution as the market sentiment may not be entirely decisive.
Key Points:
- Trend: Upward trend with strong bullish momentum.
- Momentum: Bullish momentum signals with potential for further upside.
- Volatility: Consolidation phase with a slight bias towards bullish sentiment.
- Volume: Mixed signals indicating some uncertainty in market participation.
Recommendation:
Considering the overall bullish outlook, investors may consider buying opportunities on pullbacks or consolidation phases. It is essential to monitor volume and market sentiment closely for any signs of a potential reversal. Long positions could be favorable in the current market environment.
Disclaimer:
Remember that market conditions can change rapidly, and it is crucial to stay updated with the latest developments and conduct further analysis before making any investment decisions.