Technical Analysis of IJS 2024-05-10
Overview:
In analyzing the technical indicators for IJS over the last 5 days, we will delve into the trend, momentum, volatility, and volume indicators to provide a comprehensive outlook on the possible stock price movement in the coming days. By examining these key aspects, we aim to offer valuable insights and predictions to guide your investment decisions.
Trend Indicators:
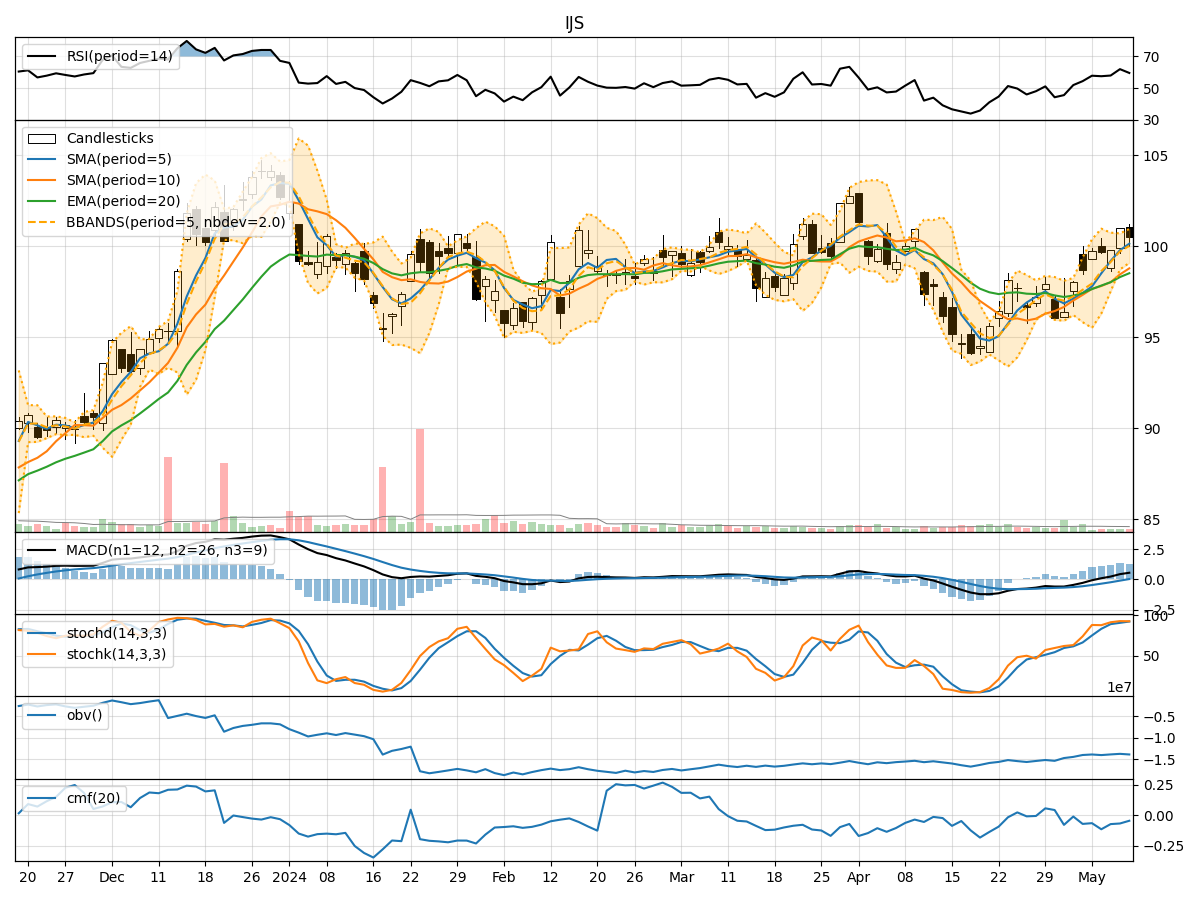
- Moving Averages (MA): The 5-day Moving Average (MA) has been consistently rising, indicating a bullish trend in the short term.
- MACD: The Moving Average Convergence Divergence (MACD) has shown positive values, suggesting upward momentum.
- EMA: The Exponential Moving Average (EMA) has been trending upwards, supporting the bullish sentiment.
Momentum Indicators:
- RSI: The Relative Strength Index (RSI) has been fluctuating around the neutral zone, indicating a balanced momentum.
- Stochastic Oscillator: Both %K and %D have been in the overbought territory, signaling a potential reversal.
- Williams %R: The Williams %R is in the oversold region, suggesting a possible buying opportunity.
Volatility Indicators:
- Bollinger Bands: The Bollinger Bands have been narrowing, indicating decreasing volatility and a potential price breakout.
- Bollinger %B: The %B indicator is hovering around the middle, suggesting a period of consolidation.
Volume Indicators:
- On-Balance Volume (OBV): The OBV has been fluctuating, indicating mixed buying and selling pressure.
- Chaikin Money Flow (CMF): The CMF has been negative, reflecting a lack of strong buying interest.
Key Observations and Opinions:
- Trend: The trend indicators suggest a bullish sentiment in the short term, supported by the rising moving averages and positive MACD values.
- Momentum: The momentum indicators show mixed signals, with RSI indicating a neutral stance, while stochastic oscillators suggest a potential reversal.
- Volatility: Volatility has been decreasing, as indicated by the narrowing Bollinger Bands, signaling a period of consolidation.
- Volume: The volume indicators reflect mixed trading activity, with OBV fluctuating and CMF showing a lack of strong buying interest.
Conclusion:
Based on the analysis of the technical indicators, the stock price of IJS is likely to experience sideways movement in the coming days. The bullish trend indicated by moving averages and MACD may be offset by the mixed signals from momentum and volume indicators. The decreasing volatility suggests a period of consolidation, while the lack of strong buying interest reflected in volume indicators may limit significant price movements. Therefore, it is advisable to exercise caution and closely monitor the price action for potential entry or exit points.