Technical Analysis of ILCB 2024-05-10
Overview:
In analyzing the technical indicators for ILCB stock over the last 5 days, we will delve into the trend, momentum, volatility, and volume indicators to provide a comprehensive outlook on the possible future stock price movement. By examining these key indicators, we aim to offer valuable insights and recommendations for potential investors.
Trend Indicators:
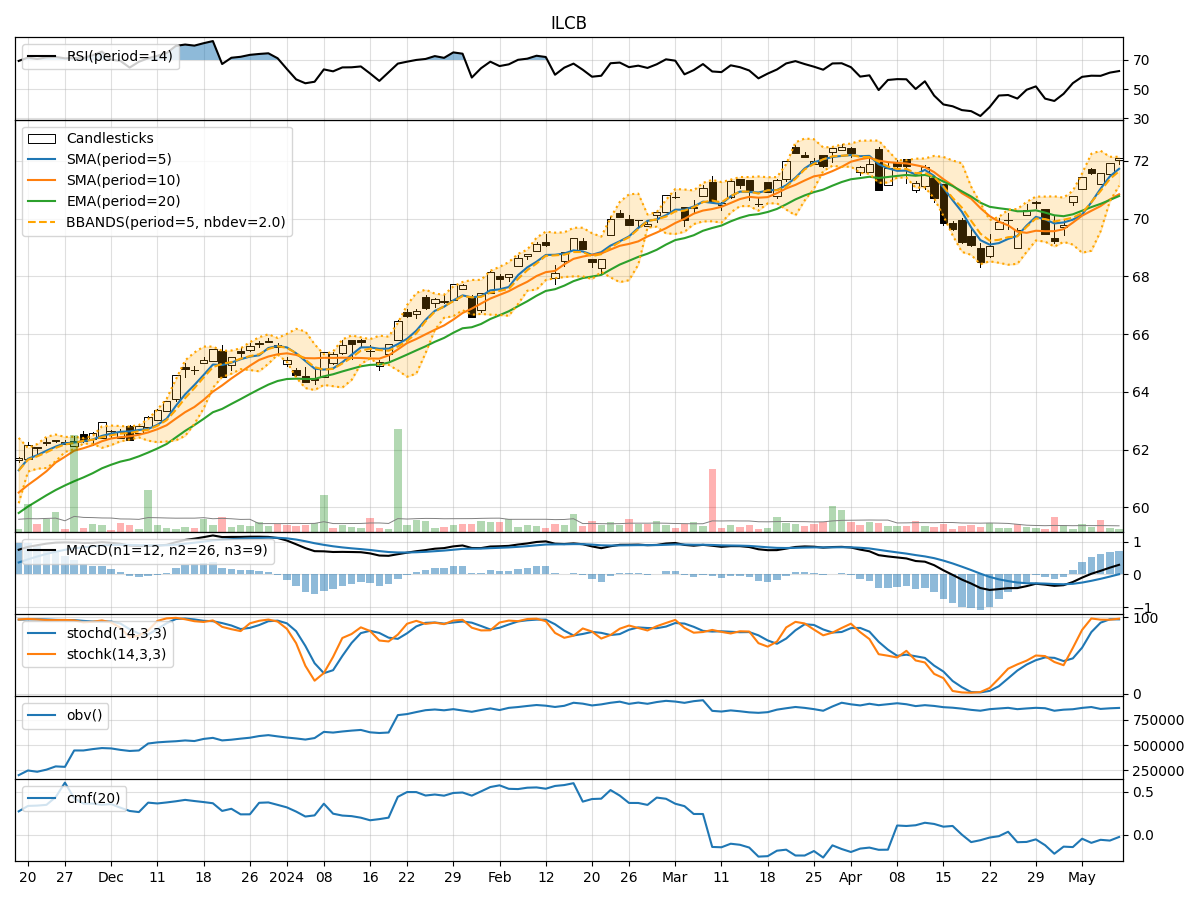
- Moving Averages (MA): The 5-day moving average has been consistently rising, indicating a bullish trend in the short term.
- MACD: The MACD line has been above the signal line for the past 5 days, suggesting a bullish momentum.
- MACD Histogram: The histogram has been increasing, indicating strengthening bullish momentum.
Momentum Indicators:
- RSI: The RSI has been trending upwards, reaching levels above 60, indicating increasing buying pressure.
- Stochastic Oscillator: Both %K and %D have been in overbought territory, suggesting a potential reversal or consolidation.
- Williams %R: The indicator has been hovering around oversold levels, indicating a potential buying opportunity.
Volatility Indicators:
- Bollinger Bands: The stock price has been trading within the bands, with the bands narrowing, suggesting a period of consolidation.
- Bollinger %B: The %B indicator has been fluctuating around the midline, indicating a lack of clear trend direction.
Volume Indicators:
- On-Balance Volume (OBV): The OBV has been fluctuating, indicating indecision among investors.
- Chaikin Money Flow (CMF): The CMF has been negative, suggesting selling pressure in the stock.
Key Observations:
- The trend indicators suggest a bullish sentiment in the short term.
- Momentum indicators show mixed signals, with overbought conditions indicating a potential reversal.
- Volatility indicators point towards a period of consolidation.
- Volume indicators reflect indecision and selling pressure in the market.
Conclusion:
Based on the analysis of the technical indicators, the next few days for ILCB stock could see sideways movement or consolidation as the stock price may continue to trade within a range. Investors should closely monitor the stochastic oscillator for potential reversal signals and the Bollinger Bands for any breakout opportunities. Overall, the stock is currently in a neutral position, and it is advisable to wait for clearer signals before making any significant trading decisions.