Technical Analysis of ILCG 2024-05-10
Overview:
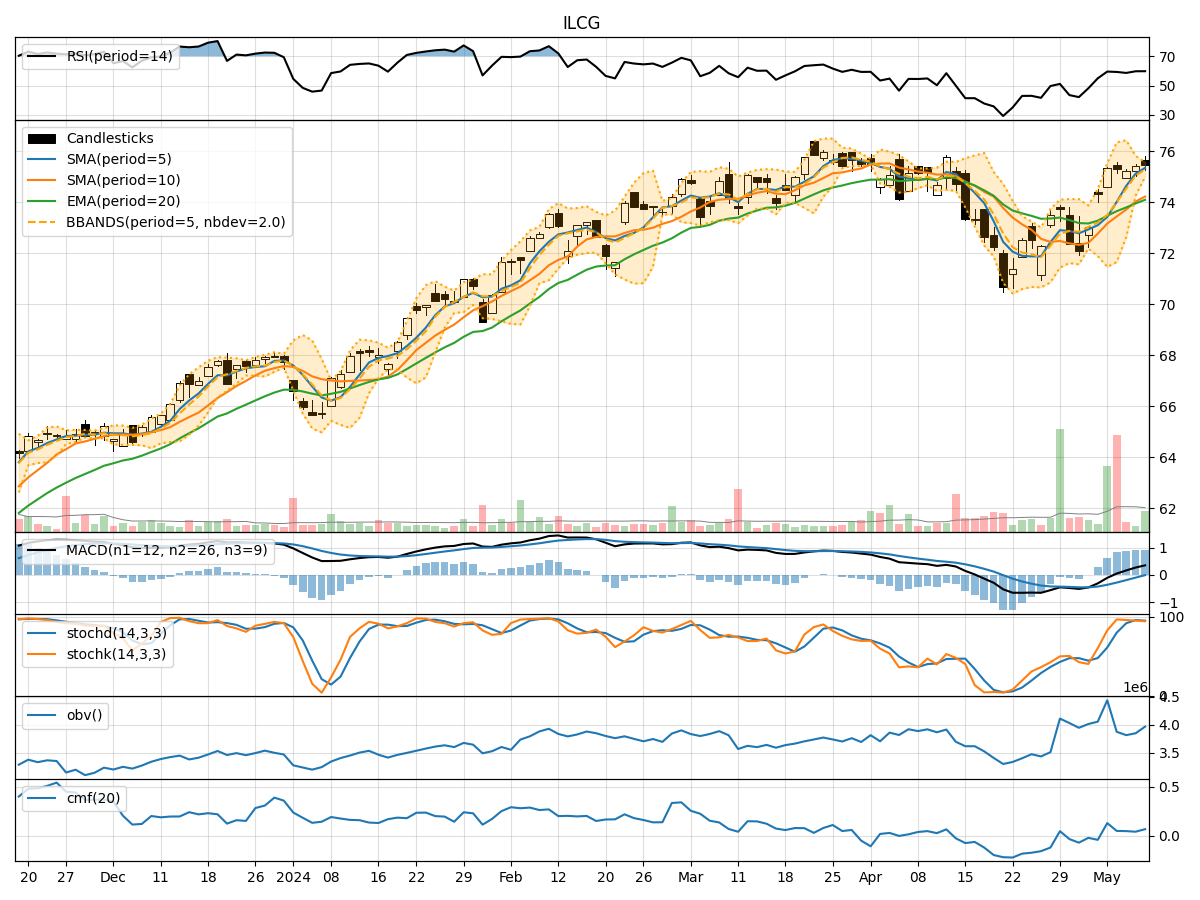
In analyzing the technical indicators for ILCG over the last 5 days, we will delve into the trend, momentum, volatility, and volume indicators to provide a comprehensive outlook on the possible stock price movement in the coming days.
Trend Analysis:
- Moving Averages (MA): The 5-day Moving Average has been consistently above the Simple Moving Average (SMA) and Exponential Moving Average (EMA), indicating a bullish trend.
- MACD: The MACD line has been consistently above the signal line, with the MACD Histogram showing an increasing positive trend, further supporting a bullish sentiment.
Momentum Analysis:
- RSI: The Relative Strength Index (RSI) has been hovering around the 60-70 range, indicating a neutral to slightly bullish momentum.
- Stochastic Oscillator: Both %K and %D have been in the overbought territory, suggesting a potential reversal or consolidation in the near future.
Volatility Analysis:
- Bollinger Bands: The stock price has been trading within the Bollinger Bands, with the bands narrowing over the last few days, indicating decreasing volatility.
- Bollinger %B: The %B indicator has been fluctuating around the midline, suggesting a lack of clear direction in price movement.
Volume Analysis:
- On-Balance Volume (OBV): The OBV has shown mixed signals, with some days experiencing positive volume accumulation and others showing distribution.
- Chaikin Money Flow (CMF): The CMF has been relatively low, indicating a lack of strong buying or selling pressure.
Conclusion:
Based on the analysis of the technical indicators, the stock of ILCG is likely to experience sideways consolidation in the coming days. The bullish trend indicated by moving averages and MACD may be offset by the overbought levels in the Stochastic Oscillator, suggesting a potential pullback or range-bound trading. The decreasing volatility and lack of strong volume signals further support the view of a sideways movement.
Recommendation:
Given the current market dynamics, it is advisable to exercise caution and closely monitor the price action for any signs of a breakout or reversal. Traders may consider implementing range-bound strategies, while investors could wait for a clearer trend confirmation before making significant decisions. It is essential to stay nimble and adapt to changing market conditions to capitalize on potential opportunities.