Technical Analysis of ILDR 2024-05-10
Overview:
In analyzing the technical indicators for ILDR over the last 5 days, we will delve into the trend, momentum, volatility, and volume indicators to provide a comprehensive outlook on the possible stock price movement in the coming days. By examining these key aspects, we aim to offer valuable insights and predictions to guide investment decisions.
Trend Indicators:
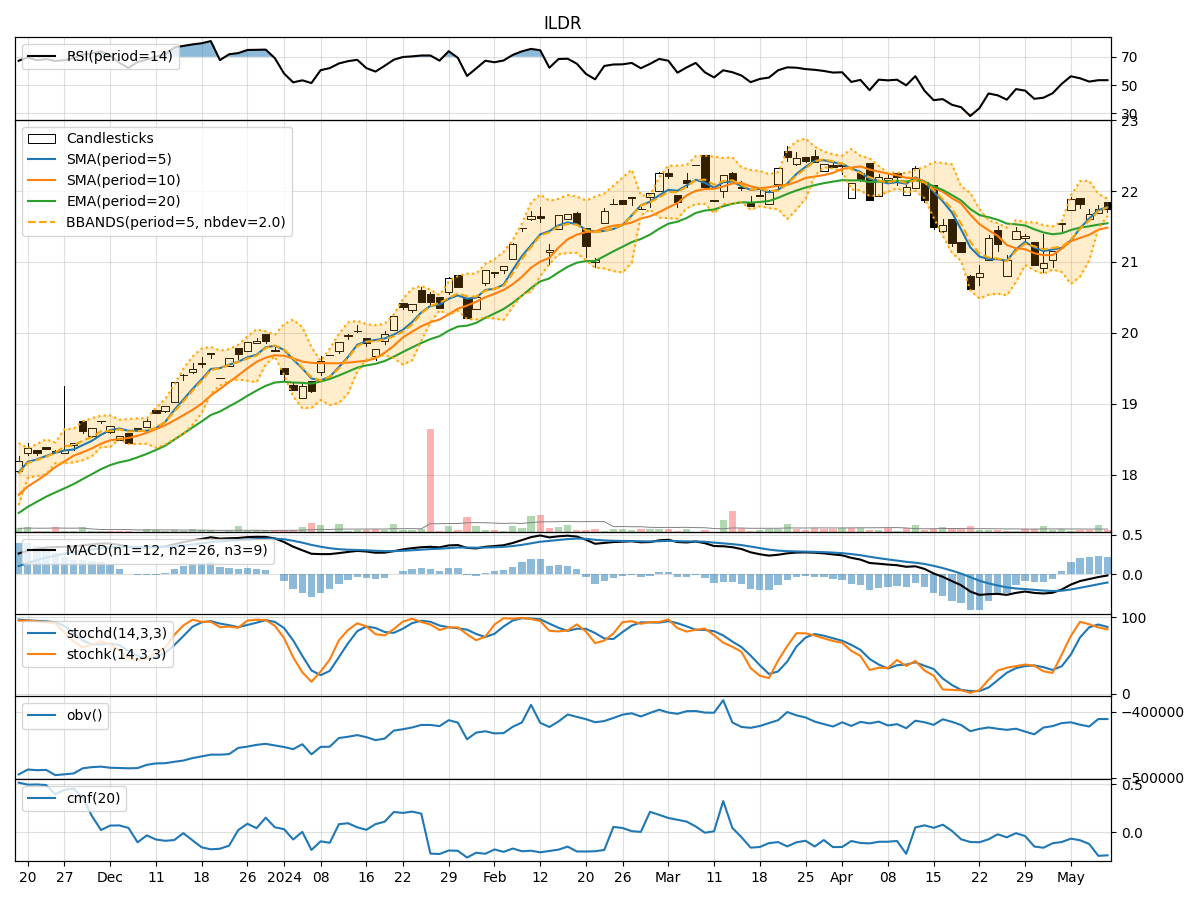
- Moving Averages (MA): The 5-day MA has been consistently above the closing prices, indicating a short-term uptrend.
- MACD: The MACD line has been negative but converging towards the signal line, suggesting a potential reversal in the downtrend.
- RSI: The RSI has been fluctuating around the neutral zone, reflecting indecision in the market sentiment.
Momentum Indicators:
- Stochastic Oscillator: The stochastic indicators have been gradually decreasing, signaling a potential bearish momentum.
- Williams %R (WillR): The WillR indicator has been hovering in the oversold territory, indicating a possible reversal to the upside.
Volatility Indicators:
- Bollinger Bands (BB): The narrowing of the Bollinger Bands suggests decreasing volatility and a potential breakout in the near future.
- Average True Range (ATR): The ATR has been declining, indicating reduced price volatility.
Volume Indicators:
- On-Balance Volume (OBV): The OBV has been fluctuating, reflecting mixed buying and selling pressure.
- Chaikin Money Flow (CMF): The CMF has been negative, indicating a lack of strong buying interest.
Key Observations:
- The trend indicators show a potential reversal in the short-term downtrend.
- Momentum indicators suggest a bearish bias in the near future.
- Volatility indicators point towards a potential breakout due to decreasing volatility.
- Volume indicators reflect mixed market participation and lack of strong buying interest.
Conclusion:
Based on the analysis of the technical indicators, the next few days' possible stock price movement for ILDR is likely to be sideways with a slight bearish bias. While there are indications of a potential trend reversal in the short term, the overall momentum and volume suggest a lack of strong buying interest to support a significant upward movement. Traders should exercise caution and closely monitor key support and resistance levels for potential entry or exit points.