Technical Analysis of ILF 2024-05-10
Overview:
In analyzing the technical indicators for ILF over the last 5 days, we will delve into the trend, momentum, volatility, and volume indicators to provide a comprehensive outlook on the possible stock price movement in the coming days. By examining these key aspects, we aim to offer valuable insights and predictions for informed decision-making.
Trend Analysis:
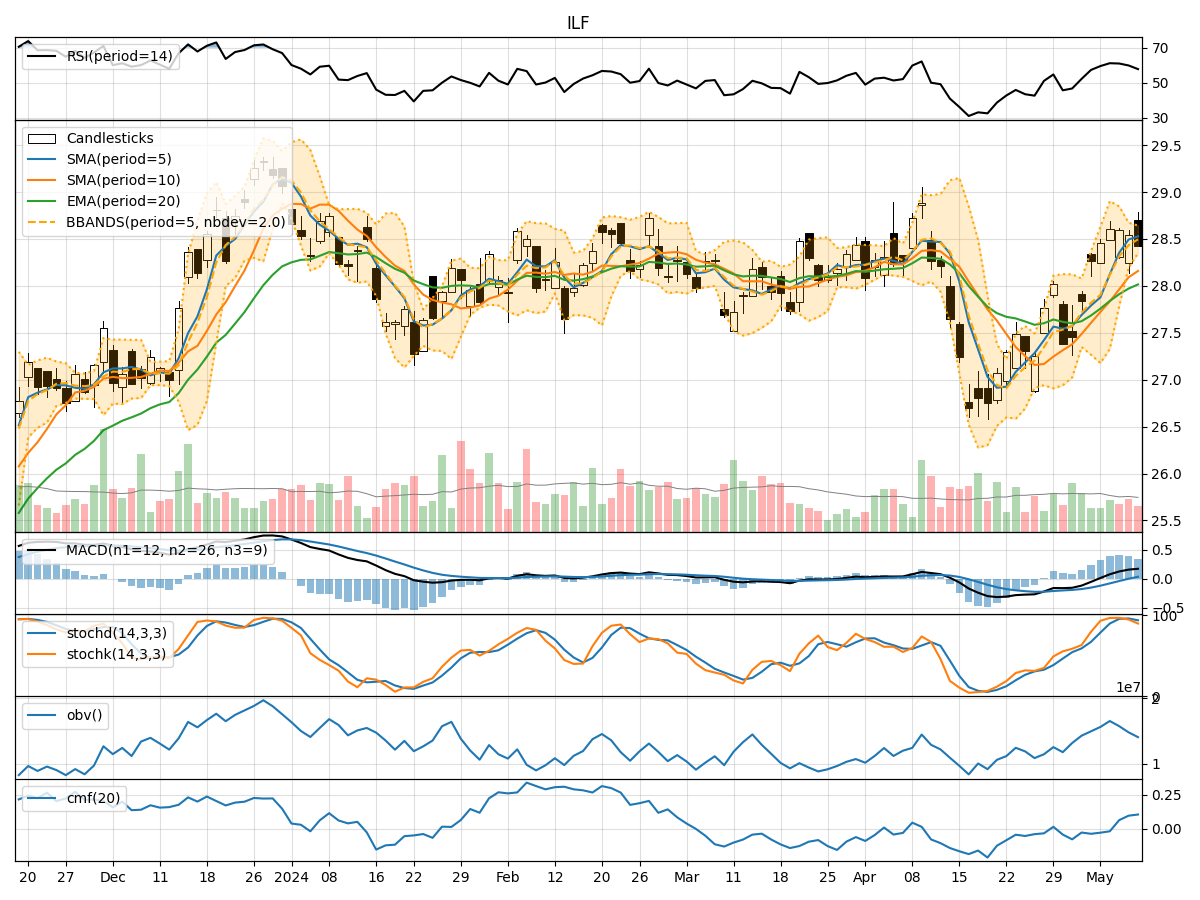
- Moving Averages (MA): The 5-day MA has been consistently above the 10-day SMA, indicating a short-term bullish trend.
- Exponential Moving Average (EMA): The EMA has been steadily increasing, reflecting positive price momentum.
- Moving Average Convergence Divergence (MACD): The MACD and signal line have been trending upwards, suggesting bullish momentum.
Key Observation: The trend indicators point towards a bullish sentiment in the short term.
Momentum Analysis:
- Relative Strength Index (RSI): RSI values have been fluctuating around the neutral zone, indicating indecision in the market.
- Stochastic Oscillator (Stoch): Stochastics have shown a decline from overbought levels, signaling a potential reversal.
- Williams %R (WillR): WillR values have been consistently negative, suggesting an oversold condition.
Key Observation: Momentum indicators suggest a neutral to bearish outlook in the near future.
Volatility Analysis:
- Bollinger Bands (BB): The bands have been narrowing, indicating decreasing volatility.
Key Observation: Volatility is decreasing, which may lead to a period of consolidation or a potential breakout.
Volume Analysis:
- On-Balance Volume (OBV): The OBV has shown mixed movements, reflecting uncertainty in trading volume.
- Chaikin Money Flow (CMF): CMF has been positive, indicating buying pressure in the market.
Key Observation: Volume indicators suggest a mixed sentiment with a slight bullish bias.
Conclusion:
Based on the analysis of trend, momentum, volatility, and volume indicators, the next few days' possible stock price movement for ILF is likely to be sideways with a slight bullish bias. The bullish trend indicated by moving averages and MACD may face resistance due to the neutral to bearish momentum signals from RSI and Stochastics. The decreasing volatility hints at a potential consolidation phase, while the mixed volume signals suggest a cautious market sentiment.
In summary, the overall outlook for ILF in the coming days leans towards a sideways movement with a slight bullish inclination, subject to potential market developments and external factors.