Technical Analysis of ILIT 2024-05-10
Overview:
In analyzing the technical indicators for ILIT over the last 5 days, we will delve into the trend, momentum, volatility, and volume indicators to provide a comprehensive outlook on the possible stock price movement in the coming days. By examining these key indicators, we aim to offer valuable insights and predictions for potential investors.
Trend Indicators:
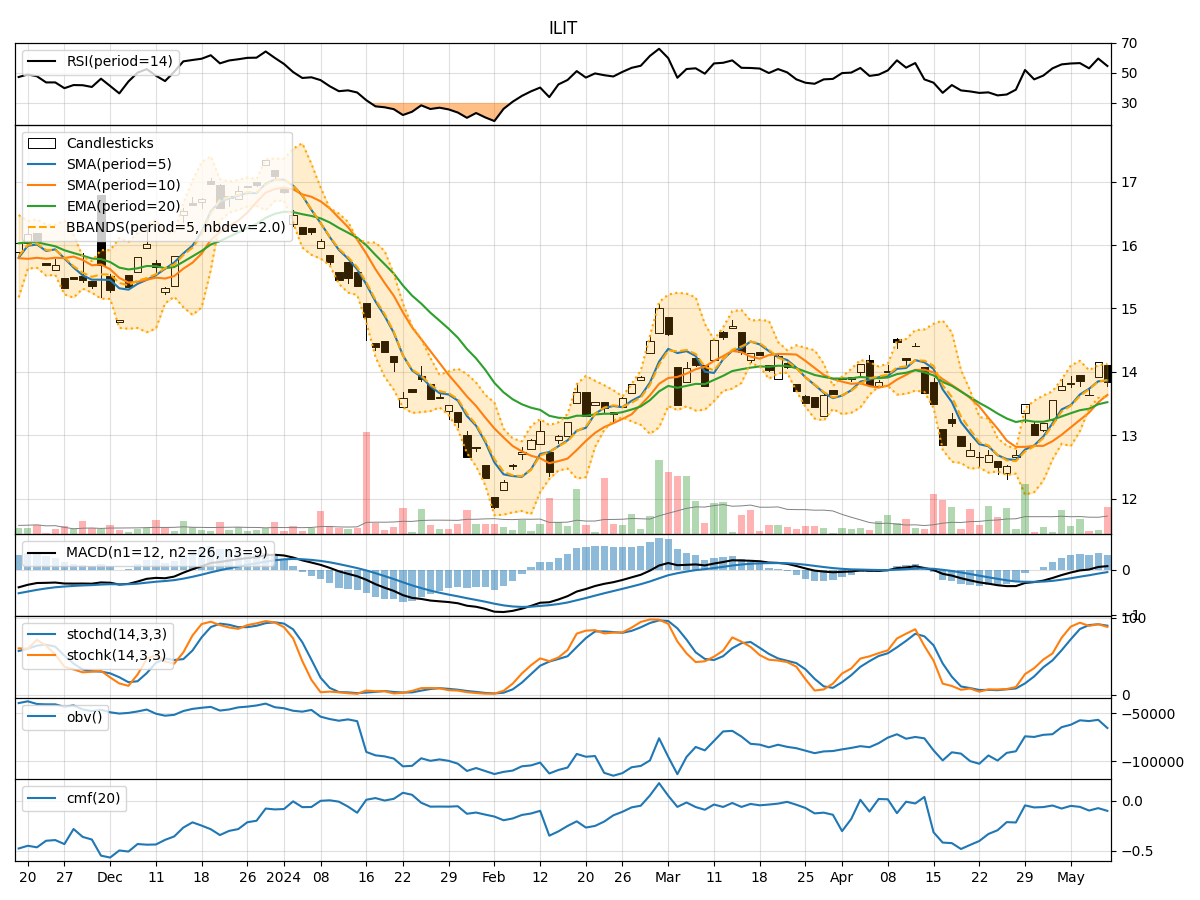
- Moving Averages (MA): The 5-day Moving Average (MA) has been consistently above the Simple Moving Average (SMA) and Exponential Moving Average (EMA) over the past 5 days, indicating a bullish trend.
- MACD: The Moving Average Convergence Divergence (MACD) has shown positive values, with the MACD line consistently above the Signal line, suggesting bullish momentum.
Momentum Indicators:
- RSI: The Relative Strength Index (RSI) has been fluctuating around the neutral zone, indicating a balanced momentum in the stock.
- Stochastic Oscillator: Both %K and %D values have been hovering around the overbought territory, suggesting a potential reversal in the short term.
Volatility Indicators:
- Bollinger Bands (BB): The stock price has mostly remained within the Bollinger Bands, indicating moderate volatility.
Volume Indicators:
- On-Balance Volume (OBV): The OBV has shown mixed signals, with no clear trend in volume accumulation or distribution.
- Chaikin Money Flow (CMF): The CMF has been negative, indicating selling pressure in the stock.
Key Observations:
- The trend indicators suggest a bullish sentiment in the stock, supported by positive MACD values.
- Momentum indicators show a mixed picture, with RSI indicating neutrality and Stochastic Oscillator hinting at a potential reversal.
- Volatility remains moderate, as indicated by the Bollinger Bands.
- Volume indicators reflect uncertainty, with OBV showing no clear trend and CMF signaling selling pressure.
Conclusion:
Based on the analysis of the technical indicators, the stock price of ILIT is likely to experience sideways movement in the coming days. The bullish trend indicated by the moving averages and MACD may be offset by the mixed signals from momentum and volume indicators. Investors should exercise caution and closely monitor the stock for any potential shifts in market sentiment.