Technical Analysis of IMAR 2024-05-10
Overview:
In analyzing the technical indicators for IMAR stock over the last 5 days, we will delve into the trends, momentum, volatility, and volume indicators to provide insights into the possible future stock price movements. By examining these indicators, we aim to offer a comprehensive analysis and make informed predictions for the upcoming days.
Trend Analysis:
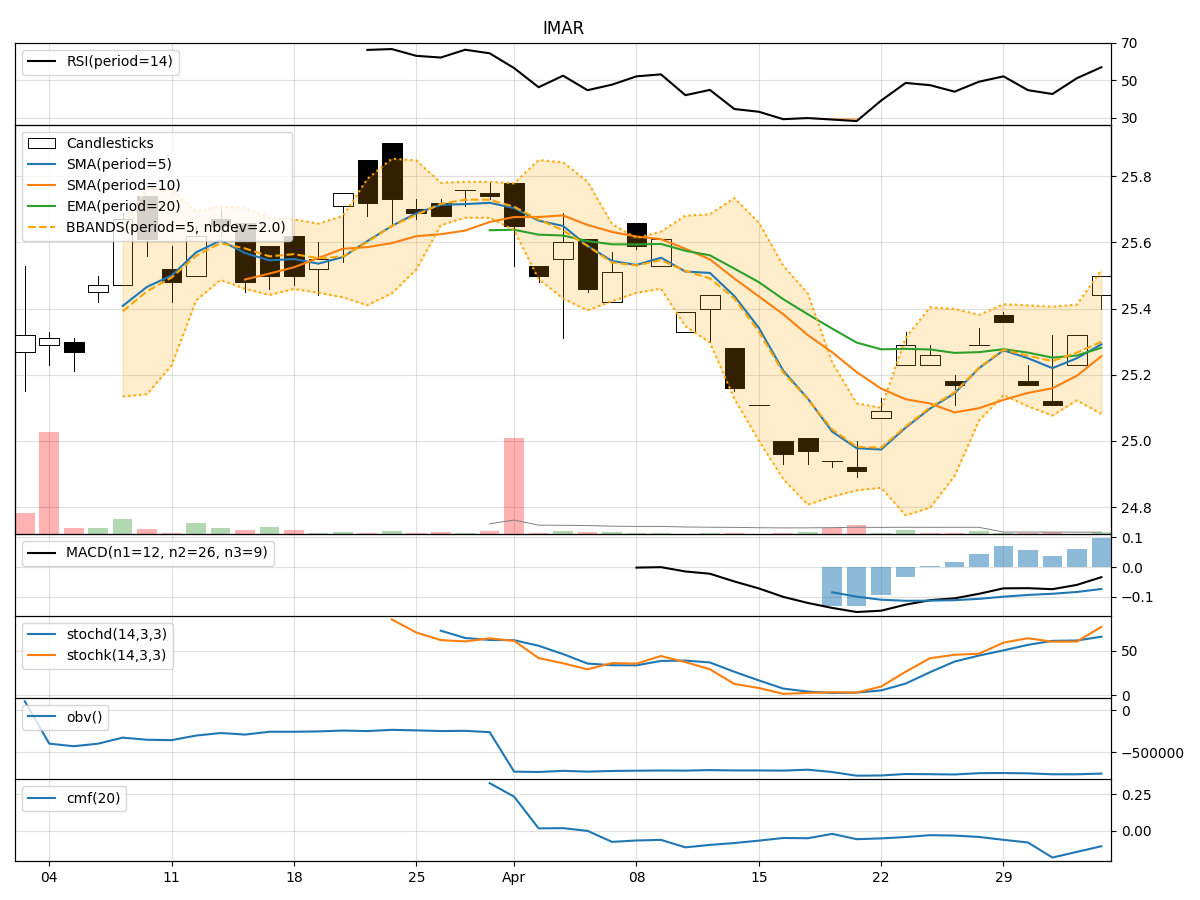
- Moving Averages (MA): The 5-day Moving Average (MA) has been consistently rising, indicating a bullish trend in the short term.
- MACD: The Moving Average Convergence Divergence (MACD) has been positive and increasing, suggesting upward momentum.
- EMA: The Exponential Moving Average (EMA) has also been on an upward trajectory, supporting the bullish trend.
Momentum Analysis:
- RSI: The Relative Strength Index (RSI) has been increasing, showing strengthening momentum.
- Stochastic Oscillator: Both %K and %D of the Stochastic Oscillator are in the overbought region, indicating a potential reversal or consolidation.
- Williams %R: The Williams %R is close to the oversold territory, suggesting a possible buying opportunity.
Volatility Analysis:
- Bollinger Bands (BB): The Bollinger Bands have been narrowing, indicating decreasing volatility.
- BB %B: The %B indicator is above 0.5, suggesting a bullish trend.
- BB Width: The narrowing of the Bollinger Bands width indicates a potential breakout or significant price movement.
Volume Analysis:
- On-Balance Volume (OBV): The OBV has been relatively stable, indicating a balance between buying and selling pressure.
- Chaikin Money Flow (CMF): The CMF has been negative, suggesting outflow of money from the stock.
Conclusion:
Based on the analysis of the technical indicators, the stock of IMAR is currently in a bullish trend with strong momentum. However, the overbought conditions in the Stochastic Oscillator and the potential reversal signal from the Williams %R indicate a possible short-term consolidation or pullback. The decreasing volatility as indicated by the Bollinger Bands narrowing suggests a period of sideways movement before a potential breakout.
Therefore, the next few days for IMAR stock are likely to see consolidation or a minor pullback before potentially resuming its upward trend. Traders should monitor the key support and resistance levels closely to identify potential entry or exit points.