Technical Analysis of IMCB 2024-05-10
Overview:
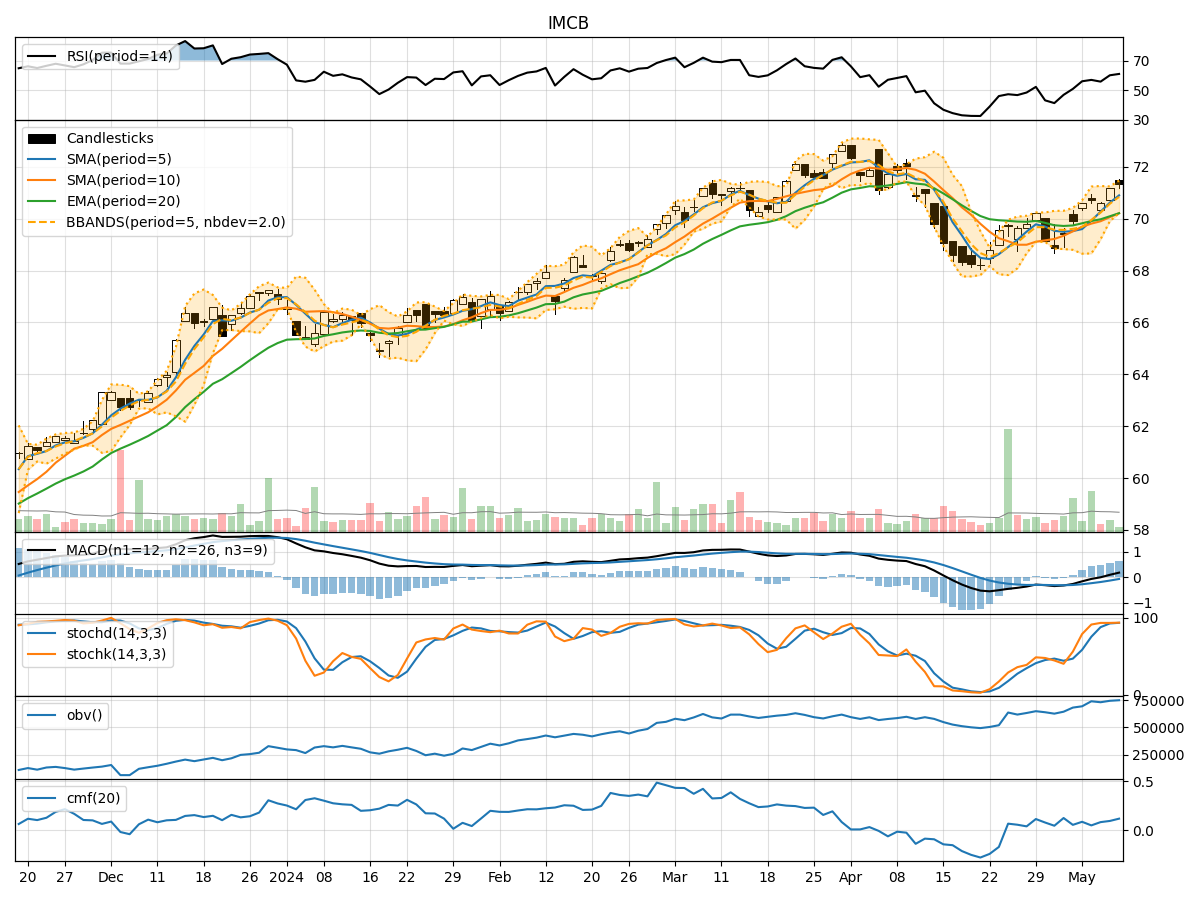
In analyzing the technical indicators for IMCB stock over the last 5 days, we will delve into the trends, momentum, volatility, and volume aspects to provide a comprehensive outlook on the possible future stock price movement. By examining key indicators such as moving averages, MACD, RSI, Bollinger Bands, and OBV, we aim to offer valuable insights and predictions for the upcoming trading days.
Trend Analysis:
- Moving Averages (MA): The 5-day MA has been consistently above the closing prices, indicating a short-term uptrend.
- MACD: The MACD line has been positive and increasing, suggesting bullish momentum.
- EMA: The EMA has been trending upwards, supporting the bullish sentiment.
Momentum Analysis:
- RSI: The RSI has been in the neutral to overbought territory, reflecting strong buying momentum.
- Stochastic Oscillator: Both %K and %D have been in the overbought zone, signaling potential overextension.
- Williams %R: The indicator has been fluctuating around the oversold region, indicating potential buying opportunities.
Volatility Analysis:
- Bollinger Bands: The stock price has been trading within the bands, showing moderate volatility.
- Bollinger %B: The %B indicator has been hovering around the middle range, suggesting a balanced market sentiment.
Volume Analysis:
- On-Balance Volume (OBV): The OBV has been steadily increasing, indicating accumulation by investors.
- Chaikin Money Flow (CMF): The CMF has been positive, reflecting buying pressure in the stock.
Key Observations:
- The trend indicators suggest a bullish bias with positive moving averages and MACD.
- Momentum indicators show a mix of overbought and oversold conditions, hinting at potential price consolidation.
- Volatility remains moderate, as indicated by Bollinger Bands.
- Increasing OBV and positive CMF signal underlying strength in buying interest.
Conclusion:
Based on the technical analysis of the indicators, the stock is likely to continue its upward trajectory in the near term. However, given the overbought signals in the momentum indicators, we may see a short-term consolidation or minor pullback before the uptrend resumes. Traders should watch for potential entry points during any dips while maintaining a bullish outlook on IMCB stock.