Technical Analysis of IMCV 2024-05-10
Overview:
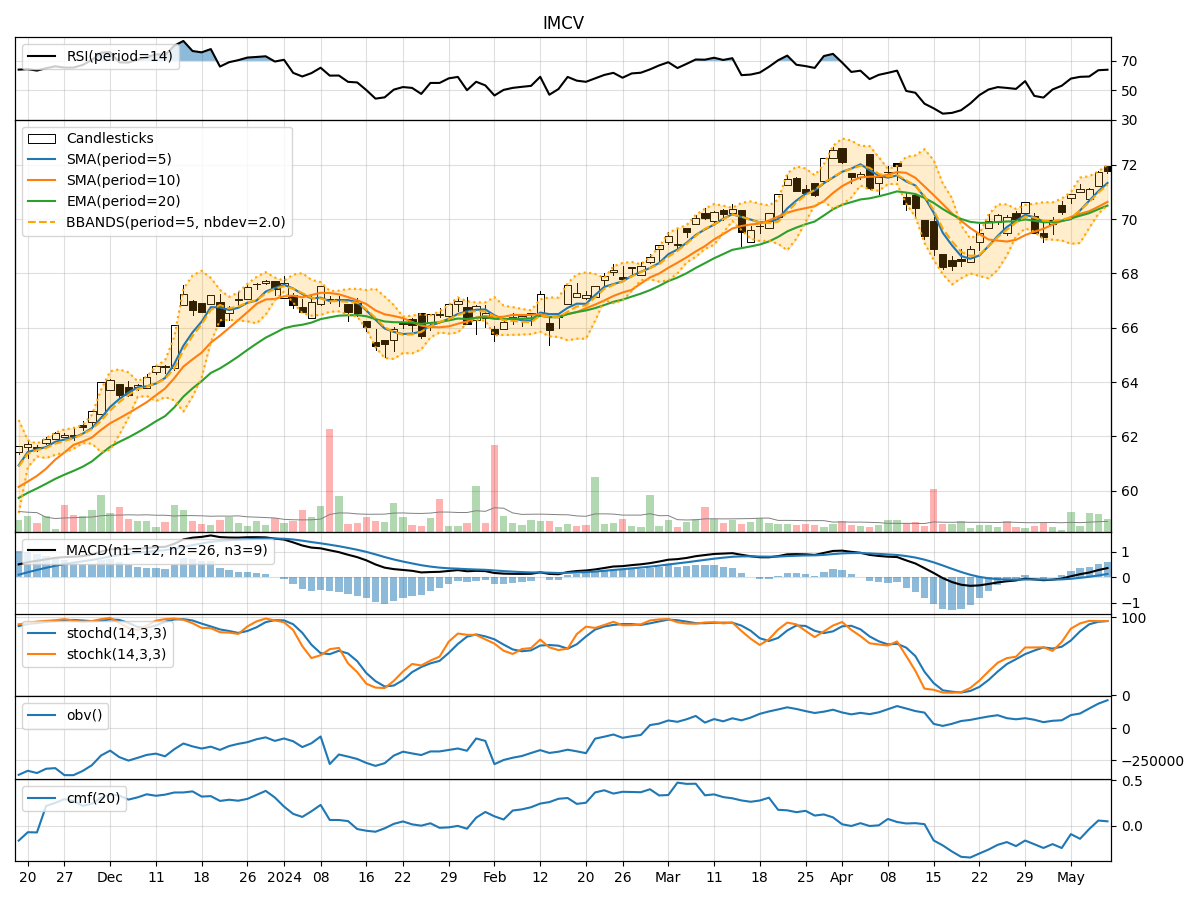
In analyzing the technical indicators for IMCV stock over the last 5 days, we will delve into the trends, momentum, volatility, and volume aspects to provide a comprehensive outlook on the possible stock price movement in the coming days. By examining key indicators such as moving averages, MACD, RSI, Bollinger Bands, and OBV, we aim to offer valuable insights and predictions for potential price movements.
Trend Analysis:
- Moving Averages (MA): The 5-day MA has been consistently above the closing prices, indicating a short-term uptrend.
- MACD: The MACD line has been trending upwards, with the MACD histogram showing positive values, suggesting bullish momentum.
Momentum Analysis:
- RSI: The RSI has been increasing, reaching levels above 50, indicating strengthening momentum.
- Stochastic Oscillator: Both %K and %D have been in overbought territory, suggesting a potential reversal or consolidation.
Volatility Analysis:
- Bollinger Bands (BB): The stock price has been trading within the upper Bollinger Band, indicating an overbought condition.
Volume Analysis:
- On-Balance Volume (OBV): The OBV has been increasing, reflecting accumulation by investors.
Key Observations:
- The stock is in an upward trend based on moving averages and MACD.
- Momentum indicators like RSI show bullish momentum.
- The stock is currently overbought according to the Stochastic Oscillator and Bollinger Bands.
- Volume indicators suggest positive accumulation with increasing OBV.
Conclusion:
Based on the technical analysis of the indicators, the next few days for IMCV stock are likely to see a consolidation or pullback in price. The stock is currently overbought, indicating a potential reversal or sideways movement. Investors should exercise caution and consider taking profits or waiting for a better entry point before considering new positions.