Technical Analysis of IMFL 2024-05-10
Overview:
In analyzing the technical indicators for IMFL over the last 5 days, we will delve into the trend, momentum, volatility, and volume indicators to provide a comprehensive assessment of the stock's potential price movement. By examining these key factors, we aim to offer valuable insights and predictions for the next few days.
Trend Analysis:
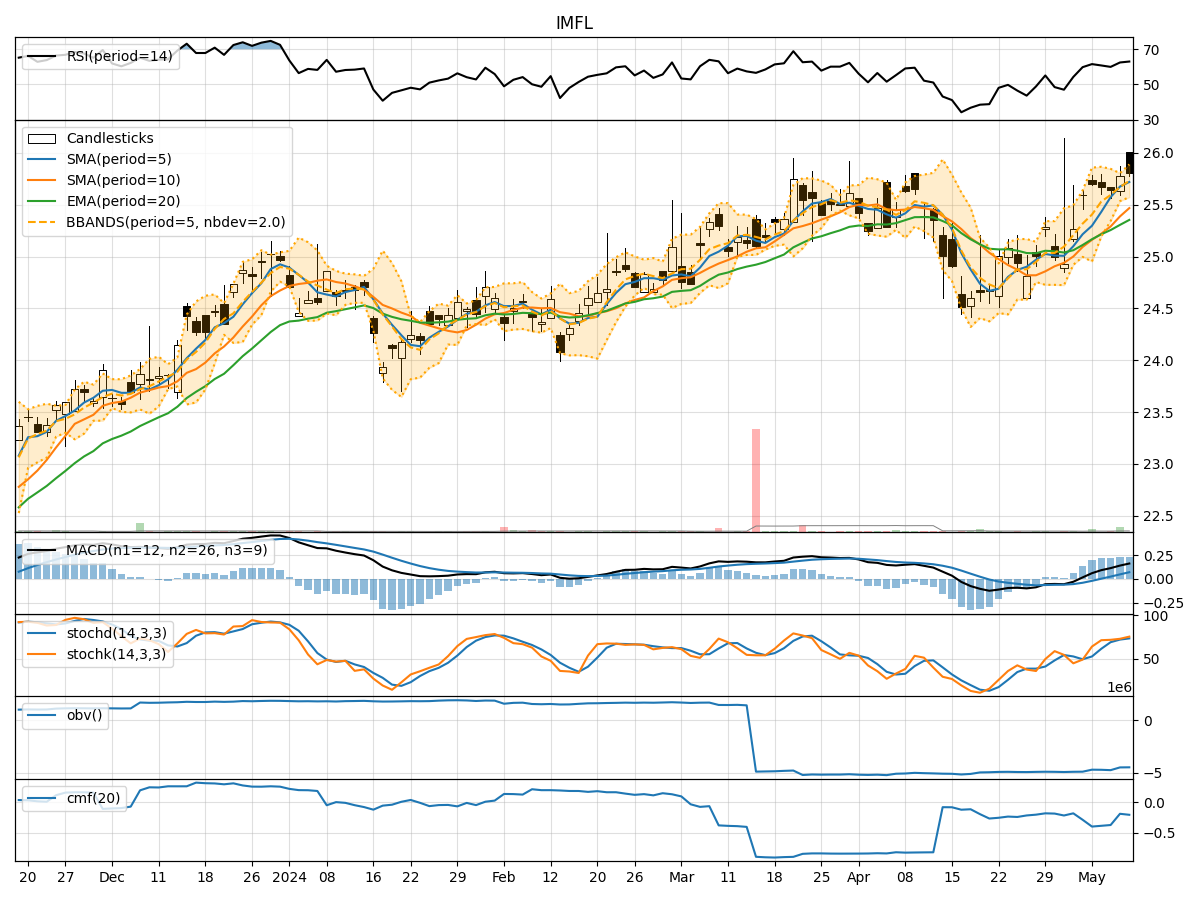
- Moving Averages (MA): The 5-day MA has been consistently above the closing price, indicating a bullish trend.
- MACD: The MACD line has been consistently above the signal line, suggesting a bullish momentum.
- EMA: The EMA has been trending upwards, supporting the bullish sentiment.
Key Observation: The trend indicators point towards an upward trend in the stock price.
Momentum Analysis:
- RSI: The RSI has been fluctuating around the 60-65 range, indicating moderate momentum.
- Stochastic Oscillator: Both %K and %D have been in the overbought territory, suggesting a potential reversal.
- Williams %R: The indicator has been hovering around the oversold region, indicating a possible buying opportunity.
Key Observation: Momentum indicators suggest a mixed sentiment with a slight bearish bias.
Volatility Analysis:
- Bollinger Bands (BB): The stock price has been trading within the bands, indicating moderate volatility.
- Bollinger %B: The %B indicator has been fluctuating around 0.8, suggesting a balanced volatility level.
Key Observation: Volatility indicators signal a stable price movement with no extreme fluctuations.
Volume Analysis:
- On-Balance Volume (OBV): The OBV has been declining, indicating a potential distribution phase.
- Chaikin Money Flow (CMF): The CMF has been negative, suggesting selling pressure in the stock.
Key Observation: Volume indicators point towards bearish sentiment with a decrease in buying interest.
Conclusion:
Based on the analysis of trend, momentum, volatility, and volume indicators, the next few days' possible stock price movement for IMFL is likely to be sideways to slightly bearish. While the trend indicators suggest an upward bias, the momentum and volume indicators indicate a potential reversal or consolidation phase. The stable volatility levels further support the view of a sideways movement.
Recommendation: It is advisable to closely monitor the stock's price action and key support/resistance levels for potential entry or exit points. Consider implementing risk management strategies to navigate the current market dynamics effectively.