Technical Analysis of IMOM 2024-05-10
Overview:
In analyzing the provided Technical Analysis (TA) data for the last 5 days of the stock, we will delve into the trend, momentum, volatility, and volume indicators to derive insights into the possible future stock price movement. By examining these key indicators, we aim to provide a comprehensive analysis and make informed predictions for the upcoming days.
Trend Indicators:
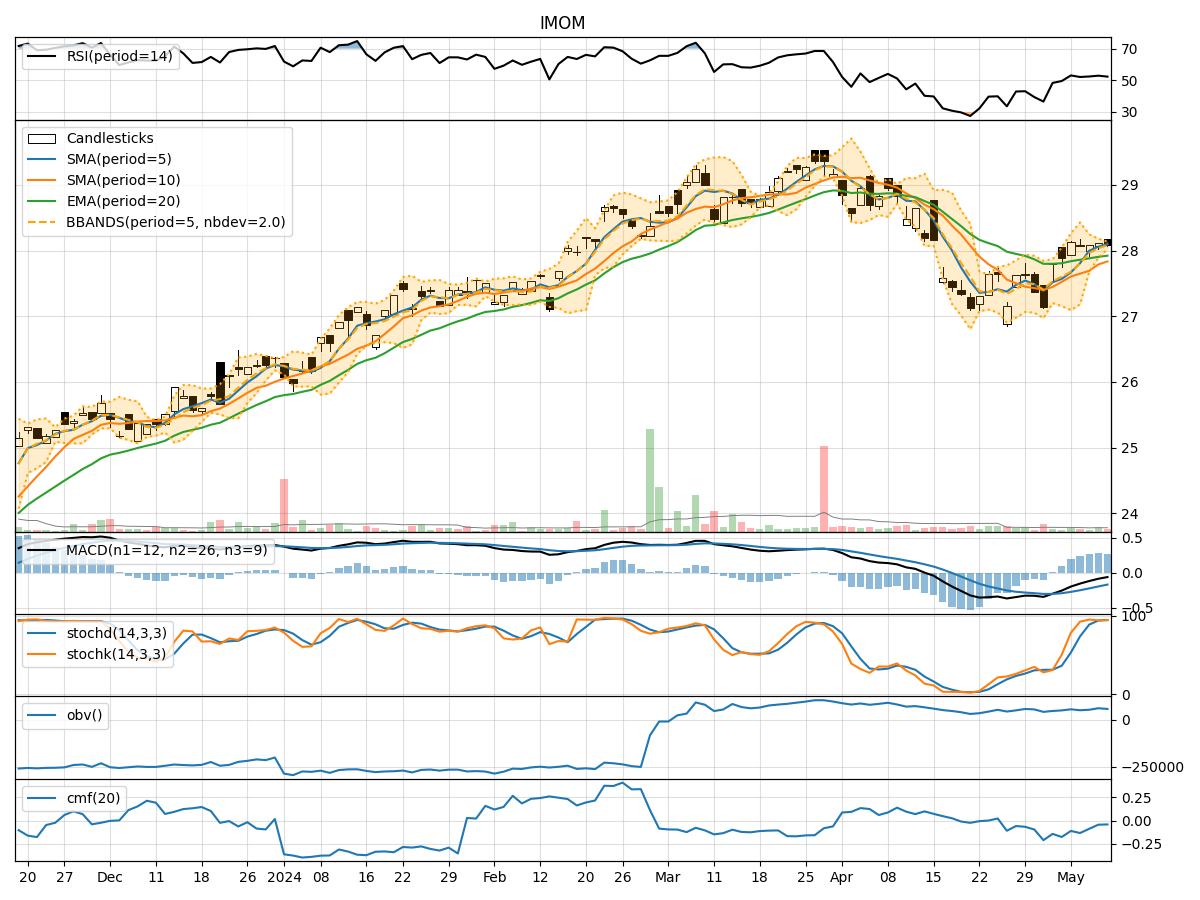
- Moving Averages (MA): The 5-day Moving Average (MA) has been consistently above the Simple Moving Average (SMA) and Exponential Moving Average (EMA) over the past 5 days, indicating a bullish trend.
- MACD: The Moving Average Convergence Divergence (MACD) has been negative but showing signs of convergence towards the signal line, suggesting a potential reversal in the trend.
- MACD Histogram: The MACD Histogram has been gradually decreasing but remains positive, indicating a weakening bullish momentum.
Momentum Indicators:
- RSI: The Relative Strength Index (RSI) has been hovering around the mid-level, indicating neutral momentum in the stock.
- Stochastic Oscillator: Both %K and %D have been consistently high, suggesting the stock is overbought.
- Williams %R: The Williams %R is in the oversold territory, indicating a potential buying opportunity.
Volatility Indicators:
- Bollinger Bands: The stock price has been trading within the Bollinger Bands, with the bands narrowing, indicating reduced volatility.
- Bollinger %B: The %B indicator is below 1, suggesting the stock is trading below the lower band, potentially indicating an oversold condition.
Volume Indicators:
- On-Balance Volume (OBV): The OBV has been fluctuating but showing a slight positive trend, indicating accumulation.
- Chaikin Money Flow (CMF): The CMF has been negative, suggesting distribution in the stock.
Key Observations and Opinions:
- The trend indicators suggest a bullish bias with signs of a potential reversal in the trend.
- Momentum indicators indicate mixed signals, with overbought conditions but also potential buying opportunities.
- Volatility indicators point towards reduced volatility and a potential oversold condition.
- Volume indicators show mixed signals with slight accumulation but overall distribution.
Conclusion:
Based on the analysis of the technical indicators, the stock is likely to experience sideways consolidation in the upcoming days with a slight bullish bias. Traders should closely monitor the MACD for a potential trend reversal confirmation and consider the oversold conditions indicated by the Williams %R for potential buying opportunities. Additionally, keeping an eye on the OBV for any significant changes in accumulation or distribution patterns will be crucial in determining the stock's future price movement.