Technical Analysis of IMSI 2024-05-10
Overview:
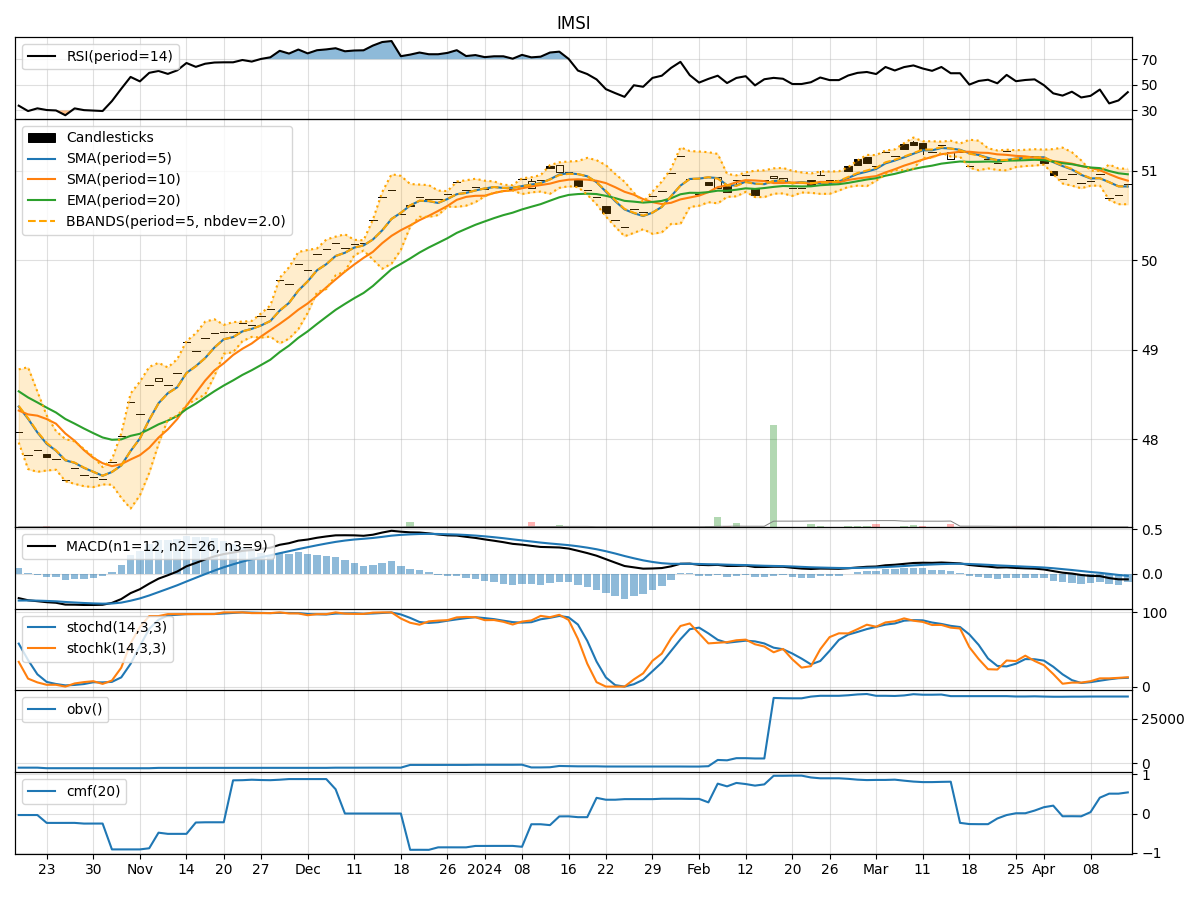
In the last 5 trading days, IMSI stock has shown a consistent uptrend in its price, with slight fluctuations in volume. The trend indicators suggest a positive momentum, supported by the moving averages and MACD. Momentum indicators like RSI and Stochastic oscillators indicate a slightly overbought condition but still within a bullish territory. Volatility indicators show a narrowing of Bollinger Bands, indicating a potential decrease in price volatility. Volume indicators like OBV and CMF suggest a slight decrease in buying pressure.
Trend Indicators Analysis:
- Moving Averages (MA): The 5-day MA has been consistently above the 10-day SMA, indicating a short-term bullish trend.
- MACD: The MACD line has been above the signal line, indicating a bullish momentum.
- EMA: The EMA has been steadily increasing, supporting the bullish trend.
Momentum Indicators Analysis:
- RSI: The RSI is in the overbought territory but has not shown any signs of divergence yet.
- Stochastic Oscillators: Both %K and %D are in the overbought zone, suggesting a potential reversal or consolidation.
Volatility Indicators Analysis:
- Bollinger Bands: The narrowing of the Bollinger Bands suggests a decrease in volatility and a possible period of consolidation.
- Bollinger %B: The %B is approaching the lower band, indicating a potential buying opportunity.
Volume Indicators Analysis:
- OBV: The On-Balance Volume has been relatively flat, indicating a balance between buying and selling pressure.
- CMF: The Chaikin Money Flow is negative, suggesting a slight decrease in buying pressure.
Key Observations:
- The stock is in a short-term bullish trend supported by moving averages and MACD.
- Momentum indicators show a slightly overbought condition, which may lead to a period of consolidation or a minor pullback.
- Volatility is decreasing, indicating a potential period of price stabilization.
- Volume indicators suggest a balance between buying and selling pressure.
Conclusion:
Based on the analysis of the technical indicators, the next few days for IMSI stock are likely to see a sideways movement or a minor pullback. The stock may consolidate within a narrow range as the momentum indicators suggest a potential reversal from the overbought condition. Traders should watch for key support and resistance levels to gauge the direction of the stock price. Overall, the outlook remains neutral to slightly bearish in the short term.