Technical Analysis of IMTB 2024-05-10
Overview:
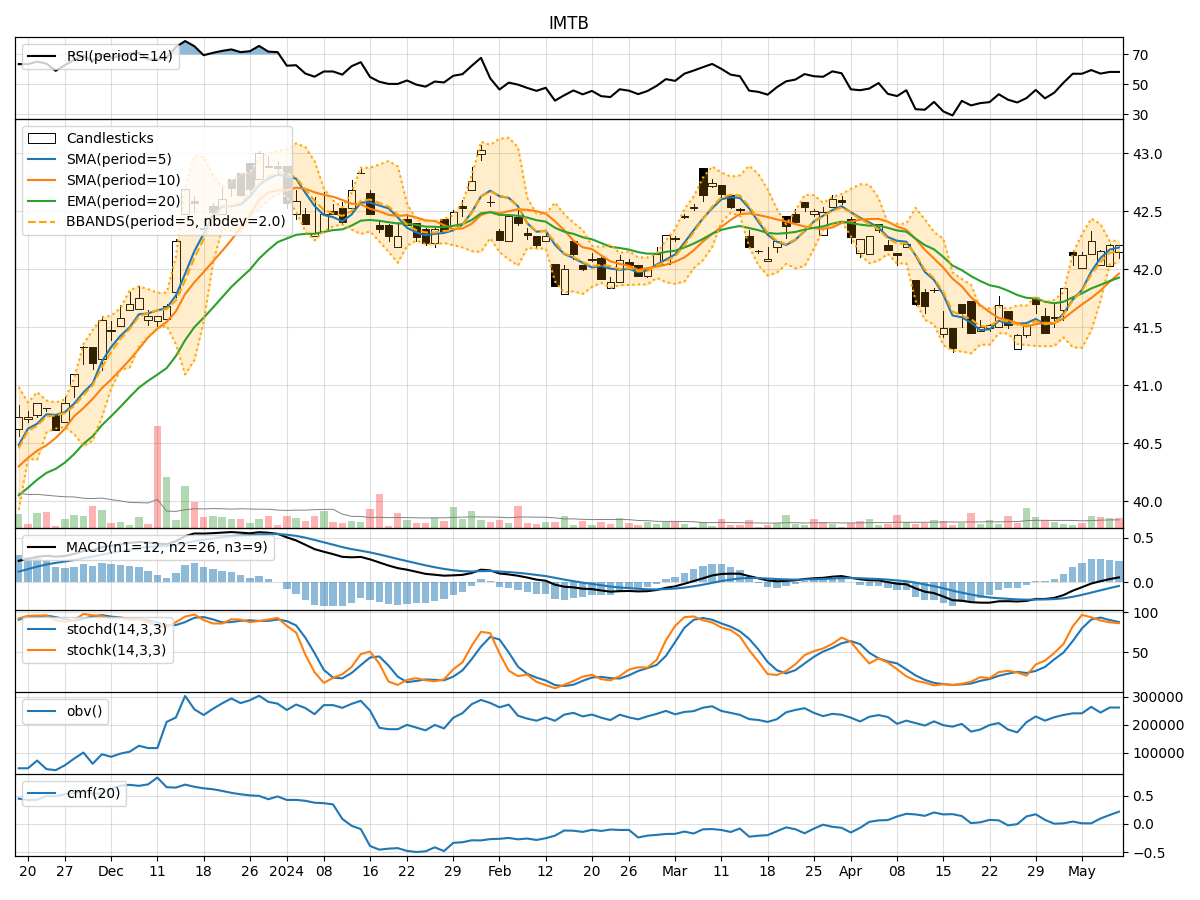
In analyzing the technical indicators for IMTB over the last 5 days, we will delve into the trend, momentum, volatility, and volume indicators to provide a comprehensive outlook on the possible stock price movement in the coming days. By examining these key indicators, we aim to offer valuable insights and predictions for informed decision-making.
Trend Analysis:
- Moving Averages (MA): The 5-day Moving Average (MA) has been consistently above the Simple Moving Average (SMA) and Exponential Moving Average (EMA), indicating a bullish trend.
- MACD: The MACD line has been consistently above the signal line, with both lines showing an upward trend, suggesting bullish momentum.
- Conclusion: The trend indicators point towards an upward trend in the stock price.
Momentum Analysis:
- RSI: The Relative Strength Index (RSI) has been fluctuating around the 50 level, indicating a neutral momentum.
- Stochastic Oscillator: Both %K and %D have been gradually decreasing but remain in the overbought territory, suggesting a potential reversal.
- Conclusion: The momentum indicators suggest a neutral to slightly bearish momentum in the stock.
Volatility Analysis:
- Bollinger Bands (BB): The stock price has been trading within the Bollinger Bands, with the bands narrowing, indicating decreasing volatility.
- Conclusion: Volatility indicators signal a decreasing volatility in the stock price.
Volume Analysis:
- On-Balance Volume (OBV): The OBV has been fluctuating but has not shown a clear trend, indicating mixed buying and selling pressure.
- Chaikin Money Flow (CMF): The CMF has been gradually increasing, suggesting a potential inflow of money into the stock.
- Conclusion: Volume indicators reflect mixed buying and selling pressure with a slight bullish bias.
Overall Conclusion:
Based on the analysis of trend, momentum, volatility, and volume indicators, the stock price of IMTB is likely to experience upward movement in the coming days. The trend indicators support a bullish outlook, while momentum indicators suggest a neutral to slightly bearish momentum. Volatility is decreasing, indicating a more stable price movement, and volume indicators show mixed but slightly bullish buying pressure.
Recommendation:
Considering the overall analysis, it is advisable to consider a long position in IMTB, with a focus on monitoring the momentum indicators for any potential reversal signals. Traders should also keep an eye on key support and resistance levels to manage risk effectively. Additionally, staying informed about any market developments or news that could impact the stock price is crucial for making well-informed trading decisions.