Technical Analysis of IMTM 2024-05-10
Overview:
In analyzing the technical indicators for IMTM over the last 5 days, we will delve into the trends, momentum, volatility, and volume indicators to provide a comprehensive outlook on the possible stock price movement in the coming days. By examining these key aspects, we aim to offer valuable insights and recommendations for potential investors.
Trend Analysis:
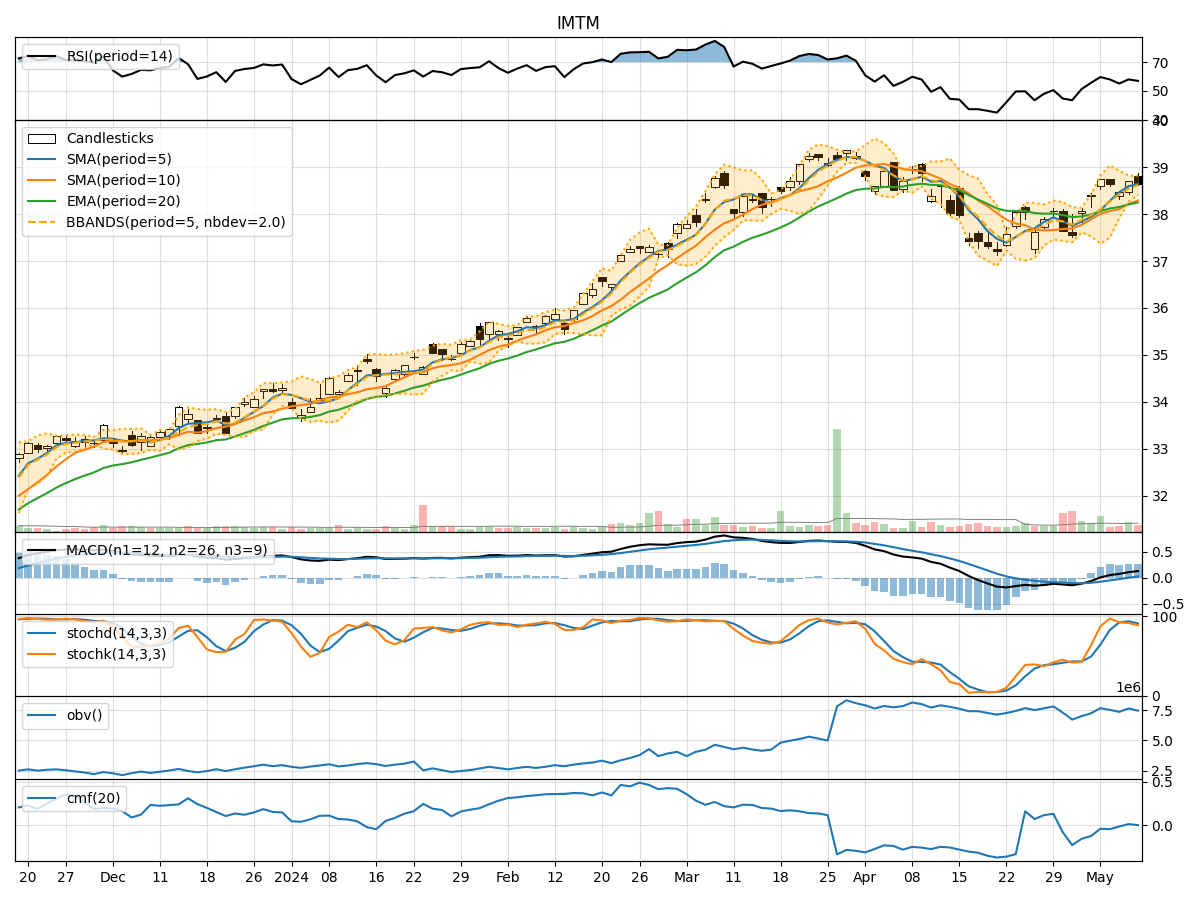
- Moving Averages (MA): The 5-day MA has been consistently above the closing prices, indicating a short-term uptrend.
- MACD: The MACD line has been positive and increasing, suggesting bullish momentum.
- EMA: The EMA has been trending upwards, supporting the bullish sentiment.
Key Observation: The trend indicators point towards an upward trend in the stock price.
Momentum Analysis:
- RSI: The RSI has been fluctuating around the 50 level, indicating neutral momentum.
- Stochastic Oscillator: Both %K and %D have been in overbought territory, signaling a potential reversal.
- Williams %R: The indicator has been hovering in the oversold region, suggesting a possible buying opportunity.
Key Observation: The momentum indicators suggest a mixed sentiment with a slight bearish bias.
Volatility Analysis:
- Bollinger Bands: The stock price has been trading within the bands, indicating normal volatility.
- Bollinger %B: The %B has been fluctuating around the midline, reflecting a balanced market sentiment.
Key Observation: Volatility indicators suggest a stable market with no extreme price movements.
Volume Analysis:
- On-Balance Volume (OBV): The OBV has been fluctuating, indicating indecision among investors.
- Chaikin Money Flow (CMF): The CMF has been negative, suggesting selling pressure.
Key Observation: Volume indicators reflect uncertainty in the market sentiment.
Conclusion:
Based on the analysis of trend, momentum, volatility, and volume indicators, the next few days' possible stock price movement for IMTM is likely to be sideways with a slight bearish bias. While the trend indicators point towards an upward trajectory, the momentum and volume indicators suggest a lack of strong conviction among investors, leading to a potential consolidation phase.
Key Conclusion: The stock is expected to trade sideways in the near term with a bearish bias due to mixed momentum and volume signals despite the positive trend indicators. Investors should exercise caution and closely monitor the price action for any potential breakout or reversal signals.