Technical Analysis of INCM 2024-05-10
Overview:
In analyzing the technical indicators for the stock of INCM over the last 5 days, we will delve into the trends, momentum, volatility, and volume indicators to provide a comprehensive outlook on the possible stock price movement in the coming days. By examining these key indicators, we aim to offer valuable insights and predictions to guide investment decisions.
Trend Analysis:
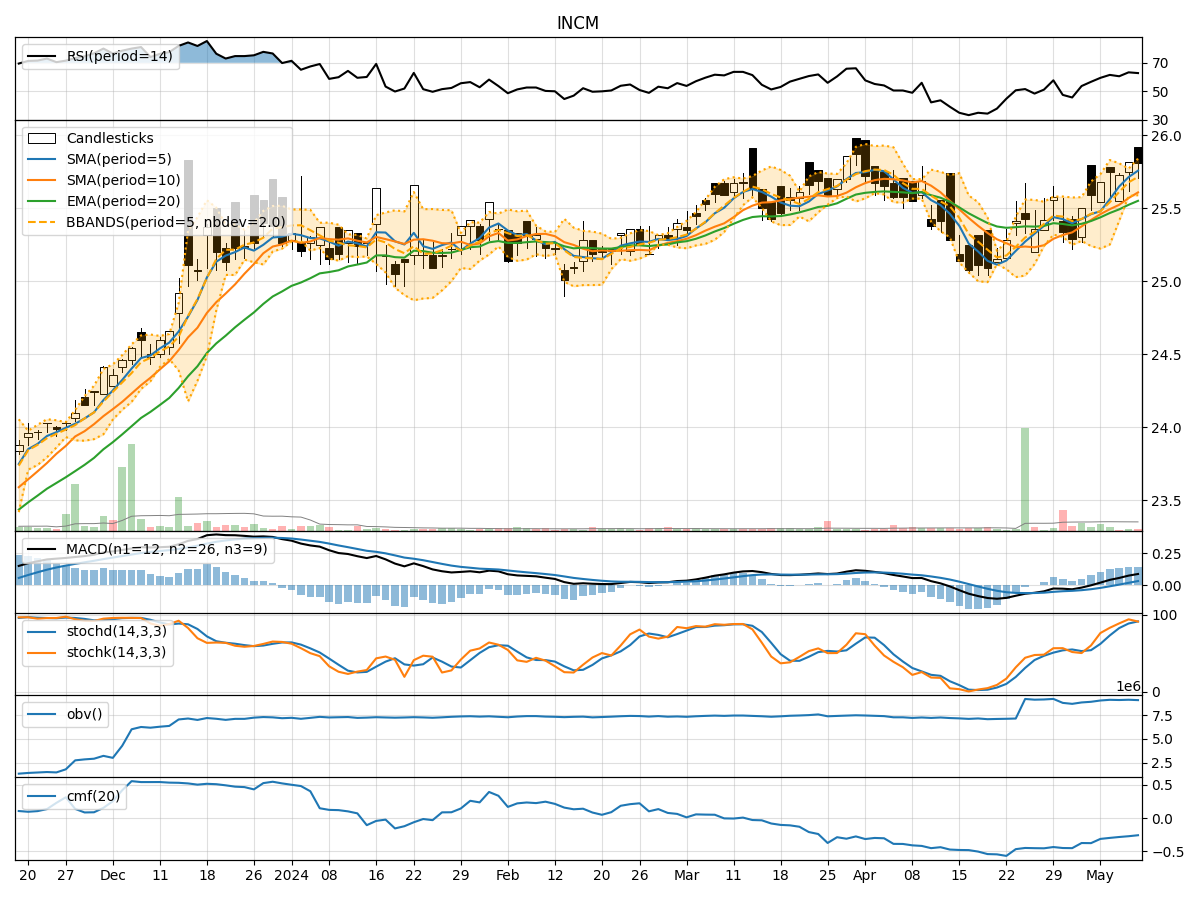
- Moving Averages (MA): The 5-day Moving Average (MA) has been consistently above the Simple Moving Average (SMA) and Exponential Moving Average (EMA), indicating a bullish trend.
- MACD: The MACD line has been consistently above the signal line, with the MACD Histogram showing positive values, suggesting a bullish momentum.
Momentum Analysis:
- RSI: The Relative Strength Index (RSI) has been fluctuating around the 60-65 range, indicating a neutral momentum.
- Stochastic Oscillator: Both %K and %D have been in the overbought territory, suggesting a potential reversal or consolidation.
Volatility Analysis:
- Bollinger Bands (BB): The stock price has been trading within the Bollinger Bands, with the bands narrowing, indicating decreasing volatility.
- Bollinger %B: The %B indicator has been hovering around 0.8, suggesting the stock is trading near the upper band.
Volume Analysis:
- On-Balance Volume (OBV): The OBV has been fluctuating, indicating a balance between buying and selling pressure.
- Chaikin Money Flow (CMF): The CMF has been negative, indicating a bearish money flow trend.
Conclusion:
Based on the analysis of the technical indicators, the stock of INCM is likely to experience sideways movement in the next few days. The bullish trend indicated by moving averages and MACD may be offset by the neutral momentum suggested by RSI and the overbought levels in the Stochastic Oscillator. The decreasing volatility and negative CMF further support the view of consolidation.
Key Points: - Trend: Upward - Momentum: Neutral - Volatility: Decreasing - Volume: Bearish
Therefore, it is recommended to closely monitor the stock price for any signs of a breakout or reversal from the current sideways trend. Investors should exercise caution and consider setting appropriate stop-loss levels to manage risk effectively.