Technical Analysis of INCO 2024-05-10
Overview:
In analyzing the technical indicators for INCO over the last 5 days, we will delve into the trend, momentum, volatility, and volume indicators to provide a comprehensive outlook on the possible stock price movement in the coming days. By examining these key indicators, we aim to offer valuable insights and predictions for potential investors.
Trend Analysis:
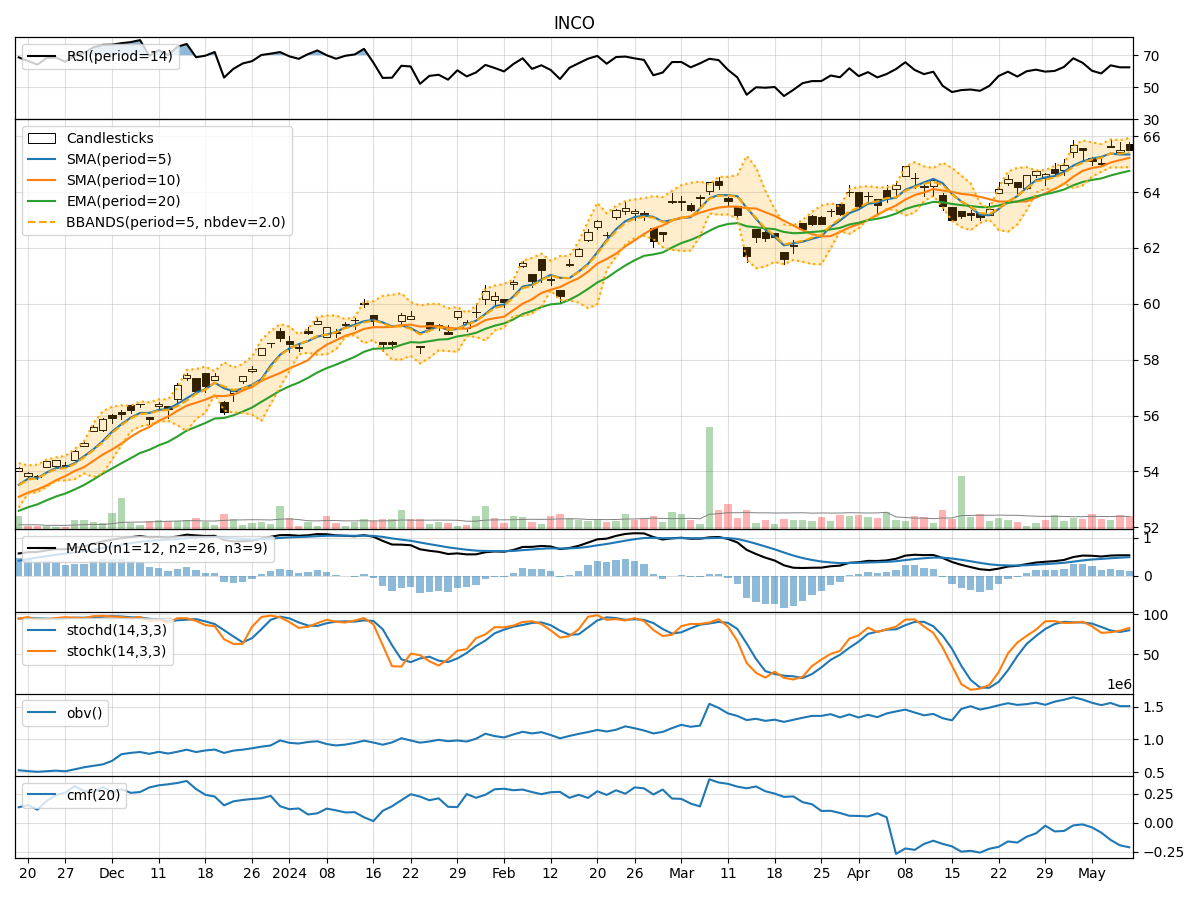
- Moving Averages (MA): The 5-day Moving Average (MA) has been relatively stable around the $65 mark, indicating a consistent price level in the short term.
- MACD: The MACD line has shown a slight positive trend, with the MACD line consistently above the signal line, suggesting a bullish momentum.
- EMA: The Exponential Moving Average (EMA) has been gradually increasing, reflecting a positive price trend.
Key Observation: The trend indicators suggest a bullish sentiment in the short term.
Momentum Analysis:
- RSI: The Relative Strength Index (RSI) has been fluctuating around the mid-level, indicating a balanced momentum between buying and selling pressure.
- Stochastic Oscillator: Both %K and %D have been in the overbought territory, suggesting a potential reversal in the short term.
- Williams %R: The Williams %R is in the oversold region, indicating a possible buying opportunity.
Key Observation: The momentum indicators signal a mixed sentiment with a slight bearish bias.
Volatility Analysis:
- Bollinger Bands (BB): The Bollinger Bands have shown a narrowing range, indicating decreasing volatility.
- Bollinger %B: The %B indicator is hovering around the middle range, suggesting a neutral stance.
Key Observation: Volatility indicators point towards a consolidation phase with reduced price fluctuations.
Volume Analysis:
- On-Balance Volume (OBV): The OBV has been relatively stable, indicating a balance between buying and selling pressure.
- Chaikin Money Flow (CMF): The CMF has been negative, suggesting a net outflow of money from the stock.
Key Observation: Volume indicators reflect a neutral sentiment with a slight bearish bias.
Conclusion:
Based on the analysis of the technical indicators, the next few days' possible stock price movement for INCO is likely to experience sideways consolidation with a slight bearish bias. While the trend indicators suggest a bullish sentiment, the momentum and volume indicators point towards a mixed and slightly bearish outlook. The volatility indicators indicate a consolidation phase with reduced price fluctuations. Investors should exercise caution and closely monitor key support and resistance levels for potential entry or exit points.
Key Takeaway:
- Trend: Upward
- Momentum: Mixed/Bearish
- Volatility: Consolidation
- Volume: Neutral/Bearish
Overall View: The stock is likely to trade sideways with a slight bearish bias in the coming days.