Technical Analysis of INMU 2024-05-10
Overview:
In analyzing the technical indicators for the stock of INMU over the last 5 days, we will delve into the trend, momentum, volatility, and volume indicators to provide a comprehensive assessment of the stock's potential price movement. By examining these key indicators, we aim to offer insights and predictions for the next few days of trading.
Trend Indicators:
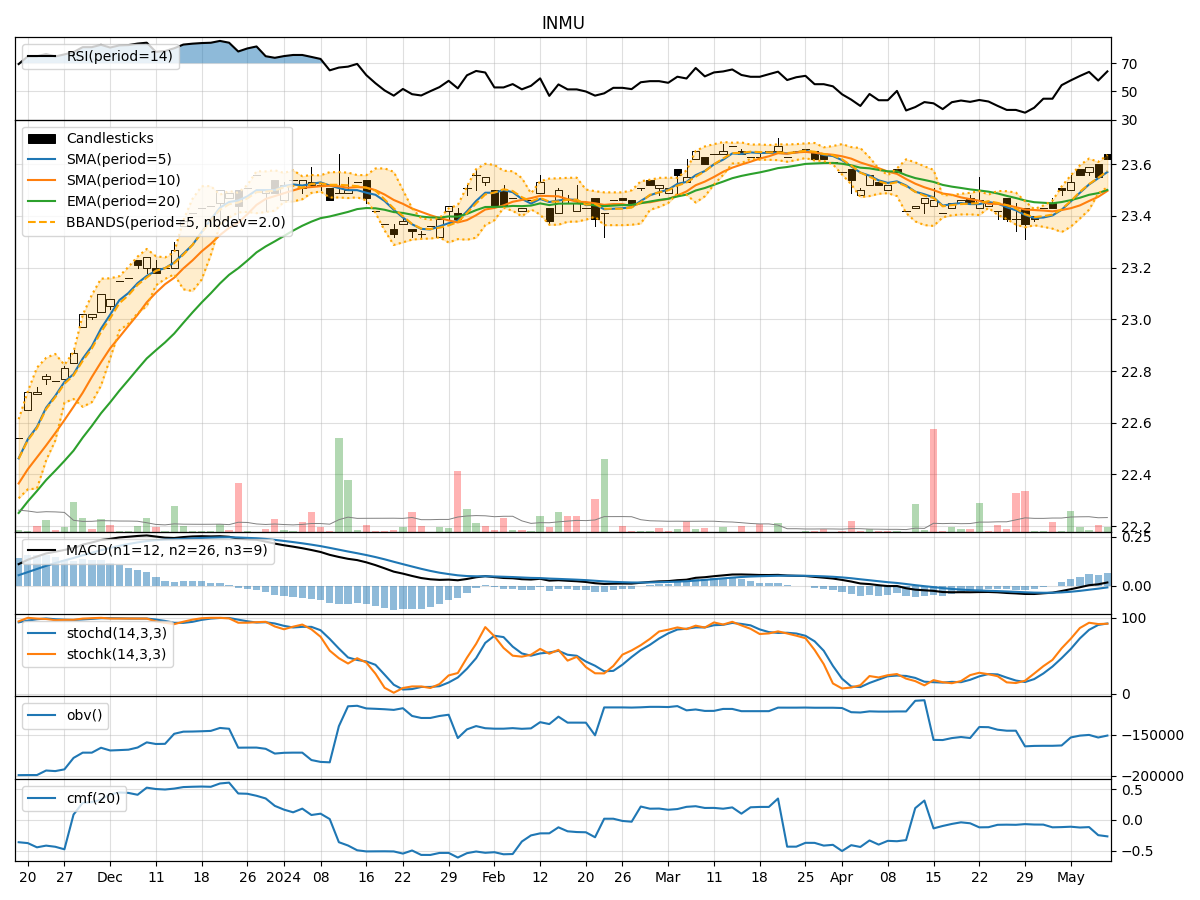
- Moving Averages (MA): The 5-day Moving Average (MA) has been showing an upward trend, indicating a positive momentum in the stock price.
- MACD (Moving Average Convergence Divergence): The MACD and Signal line have been consistently positive, suggesting a bullish trend in the stock.
- EMA (Exponential Moving Average): The EMA has been trending upwards, further supporting the bullish sentiment in the stock.
Momentum Indicators:
- RSI (Relative Strength Index): The RSI has been fluctuating within the neutral to overbought range, indicating a mixed sentiment among traders.
- Stochastic Oscillator: Both %K and %D lines of the Stochastic Oscillator have been in the overbought territory, signaling a potential reversal or consolidation.
- Williams %R (Willams Percentage Range): The Williams %R has been hovering in the oversold region, suggesting a possible reversal in the stock price.
Volatility Indicators:
- Bollinger Bands: The Bollinger Bands have been widening, indicating increased volatility in the stock price.
- Bollinger %B: The %B indicator has been fluctuating, suggesting potential buying or selling opportunities based on the band's width.
- Average True Range (ATR): The ATR has shown an increase in volatility over the past few days, indicating larger price movements.
Volume Indicators:
- On-Balance Volume (OBV): The OBV has been fluctuating, indicating mixed buying and selling pressure in the stock.
- Chaikin Money Flow (CMF): The CMF has been negative, suggesting a bearish sentiment in the stock based on the 20-day period.
Key Observations and Opinions:
- Trend: The stock is currently in an upward trend based on moving averages and MACD.
- Momentum: The momentum indicators show a mixed sentiment with potential for a reversal.
- Volatility: Volatility has increased, indicating higher price fluctuations.
- Volume: The volume indicators suggest mixed trading activity with no clear direction.
Conclusion:
Based on the analysis of the technical indicators, the stock of INMU is likely to experience increased volatility in the next few days. The upward trend in moving averages and MACD signals a bullish bias, but the mixed momentum and negative CMF indicate a potential for consolidation or a minor pullback. Traders should closely monitor key support and resistance levels for potential entry or exit points.