Technical Analysis of INNO 2024-05-10
Overview:
In analyzing the technical indicators for the stock of INNO over the last 5 days, we will delve into the trend, momentum, volatility, and volume indicators to provide a comprehensive outlook on the possible future stock price movement. By examining these key indicators, we aim to offer valuable insights and recommendations for potential investors.
Trend Analysis:
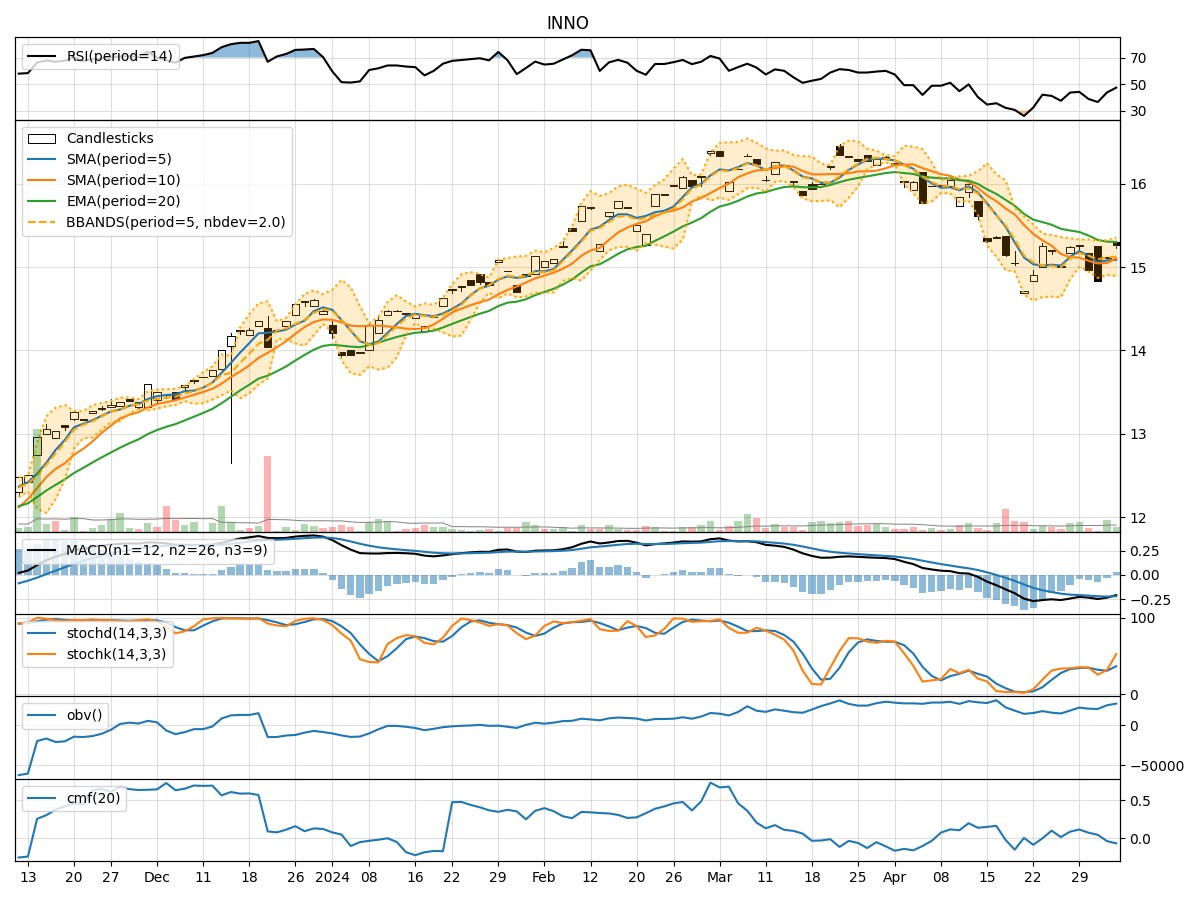
- Moving Averages (MA): The 5-day Moving Average (MA) has been relatively stable around the closing prices, indicating a short-term trend. The Simple Moving Average (SMA) and Exponential Moving Average (EMA) show a slight downward trend, suggesting a potential bearish sentiment.
- MACD: The Moving Average Convergence Divergence (MACD) has been negative, with the MACD line below the signal line. This indicates a bearish trend in the stock price.
- Conclusion: The trend indicators suggest a bearish outlook for the stock in the short term.
Momentum Analysis:
- RSI: The Relative Strength Index (RSI) has been hovering around the neutral zone, indicating a lack of strong momentum in either direction.
- Stochastic Oscillator: Both %K and %D values have been declining, suggesting a weakening momentum.
- Williams %R: The Williams %R is in the oversold territory, indicating a potential reversal or consolidation.
- Conclusion: The momentum indicators signal a neutral to bearish momentum for the stock.
Volatility Analysis:
- Bollinger Bands (BB): The Bollinger Bands have been narrowing, indicating decreasing volatility in the stock price.
- Conclusion: The volatility indicators suggest a decreasing volatility environment for the stock.
Volume Analysis:
- On-Balance Volume (OBV): The OBV has been fluctuating, indicating mixed buying and selling pressure.
- Chaikin Money Flow (CMF): The CMF has been negative, suggesting a bearish money flow.
- Conclusion: The volume indicators point towards a mixed sentiment in terms of buying and selling pressure.
Overall Conclusion:
Based on the analysis of the trend, momentum, volatility, and volume indicators, the overall outlook for the stock of INNO in the next few days is bearish. The trend indicators show a downward trend, while momentum indicators suggest a lack of strong bullish momentum. Volatility is decreasing, indicating a potential consolidation phase, and volume indicators reflect mixed buying and selling pressure.
Recommendation:
Considering the bearish trend and momentum, investors may consider exercising caution or implementing risk management strategies. It is advisable to closely monitor key support levels and wait for a potential reversal confirmation before considering any long positions. Additionally, staying informed about any significant market developments or news that could impact the stock price is crucial for making well-informed investment decisions.