Technical Analysis of INOV 2024-05-10
Overview:
In analyzing the technical indicators for INOV over the last 5 days, we will delve into the trend, momentum, volatility, and volume indicators to provide a comprehensive outlook on the possible stock price movement in the coming days. By examining these key aspects, we aim to offer valuable insights and predictions to guide your investment decisions.
Trend Indicators:
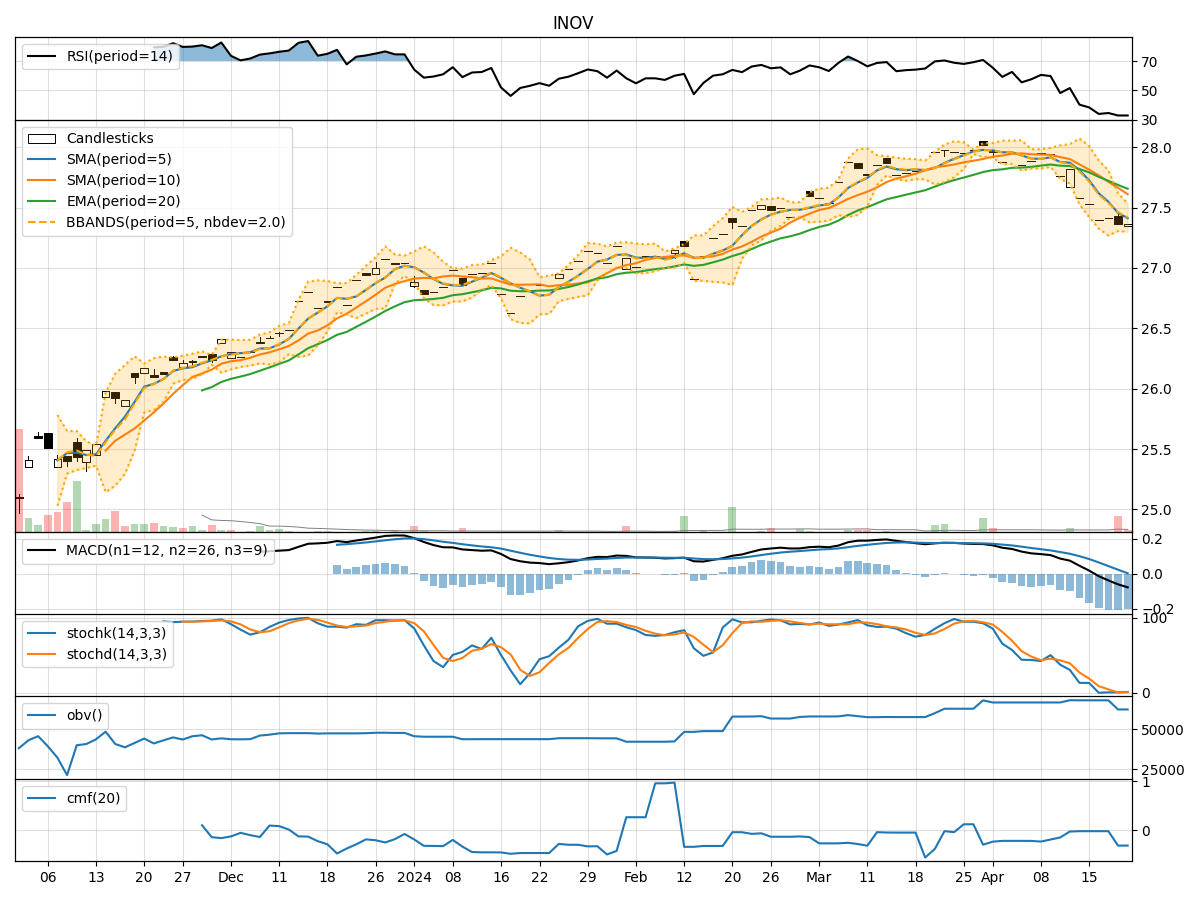
- Moving Averages (MA): The 5-day moving average has been consistently above the simple moving average (SMA) and exponential moving average (EMA), indicating a bullish trend.
- MACD: The MACD line has been consistently above the signal line, with both lines showing an upward trajectory, suggesting bullish momentum.
- MACD Histogram: The histogram has been increasing over the past 5 days, indicating strengthening bullish momentum.
Momentum Indicators:
- RSI: The Relative Strength Index (RSI) has been gradually increasing and is currently in the overbought territory, signaling a strong bullish momentum.
- Stochastic Oscillator: Both %K and %D lines have been at 100%, indicating strong bullish momentum.
- Williams %R: The indicator has consistently been at 0, suggesting an overbought condition.
Volatility Indicators:
- Bollinger Bands: The stock price has been trading within the bands, with the upper band acting as a resistance level.
- Bollinger %B: The %B indicator has been hovering around 0.8, indicating a relatively high price compared to the upper band.
- Bollinger Band Width: The band width has been narrowing, suggesting a decrease in volatility.
Volume Indicators:
- On-Balance Volume (OBV): The OBV has shown a slight increase over the last 5 days, indicating some accumulation of the stock.
- Chaikin Money Flow (CMF): The CMF has been negative, suggesting some selling pressure in the stock.
Key Observations and Opinions:
- Trend: The trend indicators point towards a strong bullish trend in the stock.
- Momentum: Momentum indicators confirm the bullish sentiment with overbought conditions.
- Volatility: Volatility has been decreasing, indicating a possible consolidation phase.
- Volume: The volume indicators show mixed signals with slight accumulation but negative CMF.
Conclusion:
Based on the analysis of the technical indicators, the next few days' possible stock price movement for INOV is likely to continue in an upward direction. The strong bullish trend, supported by momentum indicators in the overbought zone, suggests that the stock may experience further price appreciation. However, the narrowing volatility and mixed volume signals indicate a potential consolidation phase before any significant upward movement. Investors should consider holding their positions or looking for buying opportunities on pullbacks to benefit from the expected upward movement in the stock price.