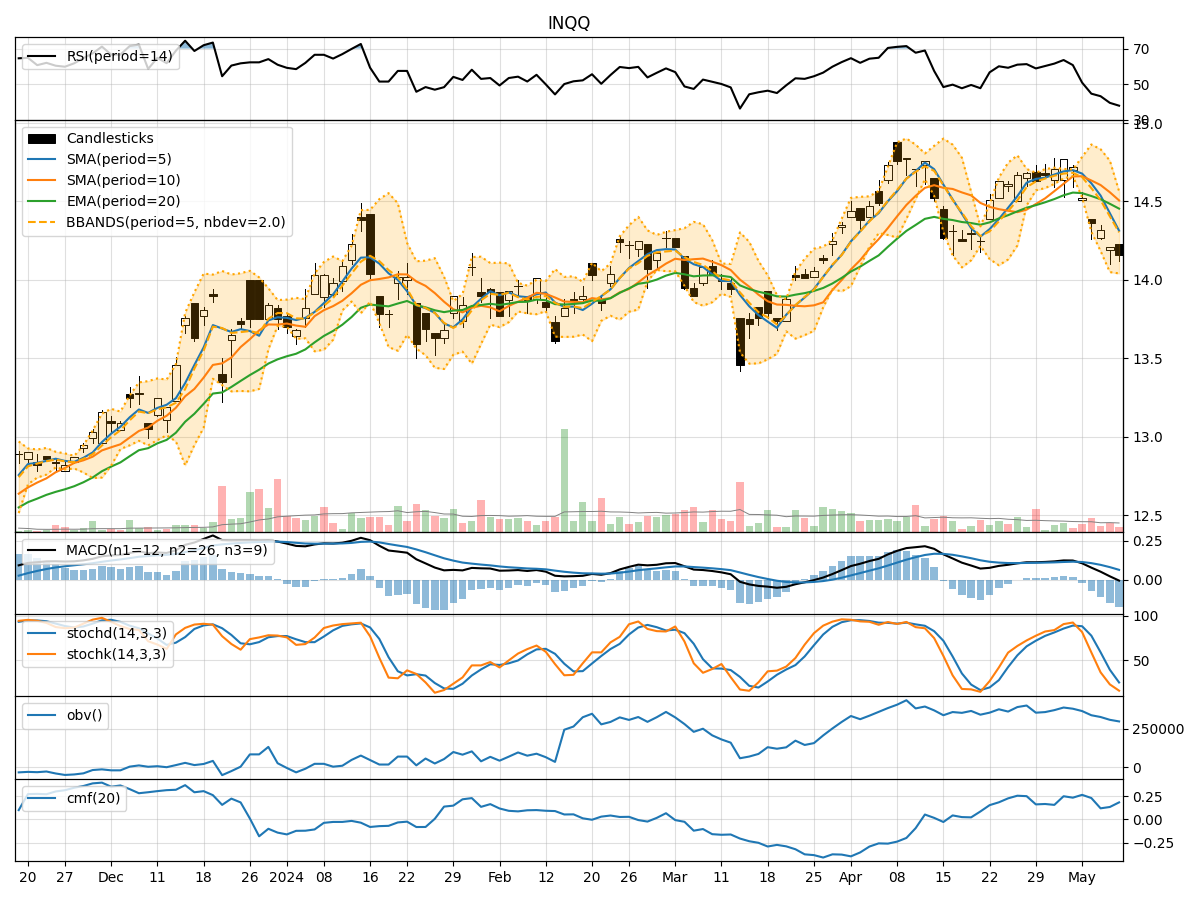
Technical Analysis of INQQ 2024-05-10
Overview:
In analyzing the technical indicators for INQQ over the last 5 days, we will delve into the trend, momentum, volatility, and volume indicators to provide a comprehensive outlook on the possible stock price movement in the coming days.
Trend Indicators:
- Moving Averages (MA): The 5-day MA has been consistently below the closing price, indicating a short-term downtrend.
- MACD: The MACD line has been below the signal line, suggesting a bearish momentum.
- EMA: The EMA has been declining, further supporting the bearish trend.
Momentum Indicators:
- RSI: The RSI has been decreasing, reflecting weakening momentum.
- Stochastic Oscillator: Both %K and %D have been declining, indicating increasing selling pressure.
- Williams %R: The indicator has been in oversold territory, signaling a potential reversal.
Volatility Indicators:
- Bollinger Bands (BB): The price has been consistently below the middle band, suggesting a downward trend.
- BB Width: The bands have been narrowing, indicating decreasing volatility.
- BB %B: The %B has been below 0.2, signaling an oversold condition.
Volume Indicators:
- On-Balance Volume (OBV): The OBV has been declining, indicating distribution.
- Chaikin Money Flow (CMF): The CMF has been relatively stable, suggesting neutral money flow.
Key Observations and Opinions:
- Trend: The trend indicators point towards a bearish outlook, with moving averages and MACD signaling a downtrend.
- Momentum: Momentum indicators also support a bearish view, with RSI and Stochastic Oscillator showing weakening momentum.
- Volatility: Volatility indicators suggest a downward trend, with Bollinger Bands and %B indicating oversold conditions.
- Volume: Volume indicators reflect a bearish sentiment, with OBV declining and CMF showing neutral money flow.
Conclusion:
Based on the analysis of the technical indicators, the next few days for INQQ are likely to see a continuation of the bearish trend. The stock price may experience further downward movement, potentially reaching oversold levels. Traders and investors should exercise caution and consider short-term selling strategies or wait for a clear reversal signal before considering long positions.