Technical Analysis of INTL 2024-05-10
Overview:
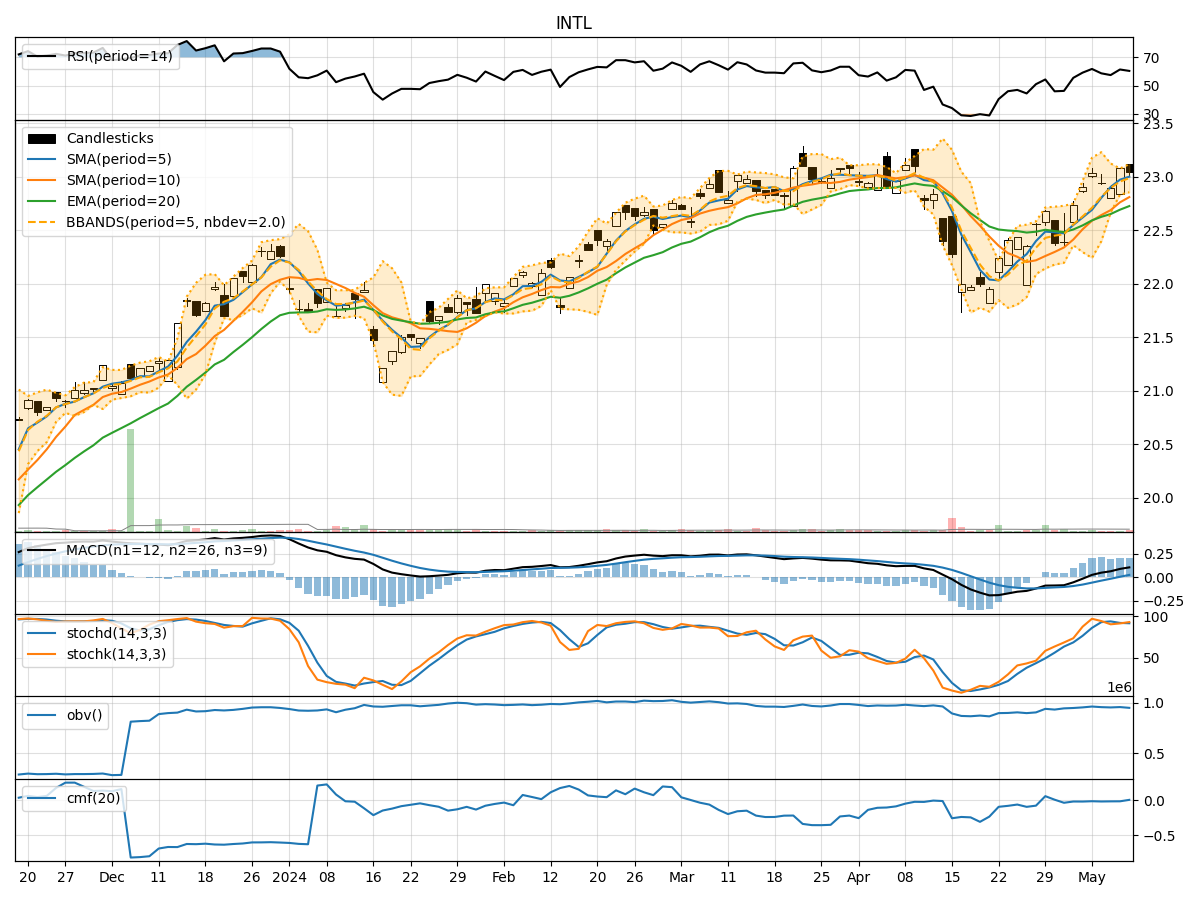
In analyzing the technical indicators for INTL over the last 5 days, we will delve into the trend, momentum, volatility, and volume indicators to provide a comprehensive outlook on the possible stock price movement in the coming days. By examining these key aspects, we aim to offer valuable insights and predictions to guide your investment decisions.
Trend Analysis:
- Moving Averages (MA): The 5-day Moving Average (MA) has been consistently above the Simple Moving Average (SMA) and Exponential Moving Average (EMA), indicating a bullish trend.
- MACD: The MACD line has been consistently above the signal line, with positive values, suggesting a bullish momentum.
- MACD Histogram: The MACD Histogram has been increasing over the past 5 days, indicating strengthening bullish momentum.
Momentum Analysis:
- RSI: The Relative Strength Index (RSI) has been fluctuating around the 60-65 range, indicating a neutral momentum.
- Stochastic Oscillator: Both %K and %D lines of the Stochastic Oscillator have been above 80, suggesting an overbought condition.
- Williams %R: The Williams %R has been hovering around -10 to -15, indicating a potential overbought situation.
Volatility Analysis:
- Bollinger Bands: The stock price has been trading within the Bollinger Bands, with the %B indicator showing values close to 1, suggesting a period of high volatility.
- Average True Range (ATR): The ATR values have been relatively stable, indicating consistent volatility levels in the stock.
Volume Analysis:
- On-Balance Volume (OBV): The OBV has shown a declining trend over the past 5 days, indicating a decrease in buying pressure.
- Chaikin Money Flow (CMF): The CMF has been negative, suggesting a lack of buying interest in the stock.
Conclusion:
Based on the analysis of the technical indicators, the stock is currently exhibiting a bullish trend with strong momentum and volatility. However, the overbought signals from the Stochastic Oscillator and Williams %R, coupled with the declining OBV and negative CMF, indicate a potential short-term correction or consolidation in the stock price.
Therefore, the next few days may see the stock price experiencing a pullback or sideways movement before potentially resuming its upward trajectory. It is advisable to closely monitor the price action and key support/resistance levels for better entry or exit points in line with the overall bullish trend.