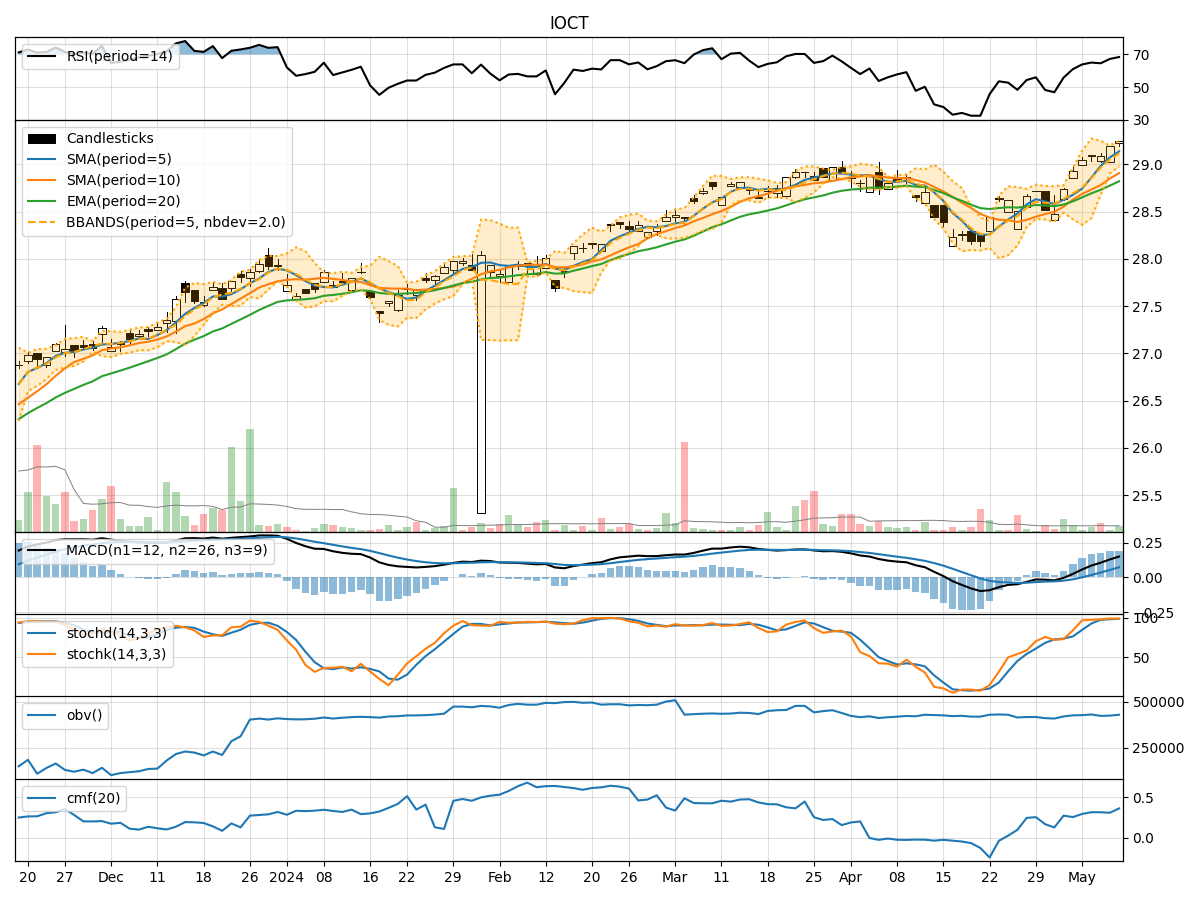
Technical Analysis of IOCT 2024-05-10
Overview:
In analyzing the technical indicators for IOCT stock over the last 5 days, we will delve into the trend, momentum, volatility, and volume indicators to provide a comprehensive outlook on the possible stock price movement in the coming days. By examining these key indicators, we aim to offer valuable insights and predictions to guide your investment decisions.
Trend Indicators:
- Moving Averages (MA): The 5-day MA has been consistently above the closing prices, indicating a bullish trend.
- MACD: The MACD line has been steadily increasing, with the MACD histogram also showing positive values, suggesting a strengthening bullish momentum.
- EMA: The EMA has been trending upwards, supporting the bullish sentiment in the short to medium term.
Momentum Indicators:
- RSI: The RSI has been in the overbought territory, indicating a strong bullish momentum.
- Stochastic Oscillator: Both %K and %D have been in the overbought zone, signaling a potential reversal or consolidation.
- Williams %R: The indicator has been hovering around the oversold region, suggesting a possible reversal in the short term.
Volatility Indicators:
- Bollinger Bands (BB): The bands have been relatively narrow, indicating low volatility in the stock price.
- BB %B: The %B indicator has been fluctuating around the midline, reflecting a lack of clear direction in price movement.
Volume Indicators:
- On-Balance Volume (OBV): The OBV has shown mixed signals with slight decreases, suggesting some distribution of shares.
- Chaikin Money Flow (CMF): The CMF has been positive, indicating buying pressure in the stock.
Key Observations and Opinions:
- Trend: The trend indicators suggest a strong bullish sentiment in the short to medium term.
- Momentum: While momentum indicators show overbought conditions, the potential for a reversal or consolidation should be considered.
- Volatility: Low volatility indicates a period of consolidation or sideways movement.
- Volume: The mixed signals in volume indicators may imply some uncertainty in market participation.
Conclusion:
Based on the analysis of the technical indicators, the next few days for IOCT stock could see further upward movement in the stock price. However, caution is advised as some indicators signal potential overbought conditions and a need for a possible correction or consolidation. Investors should closely monitor price action and key support/resistance levels to make informed decisions.