Technical Analysis of IOO 2024-05-10
Overview:
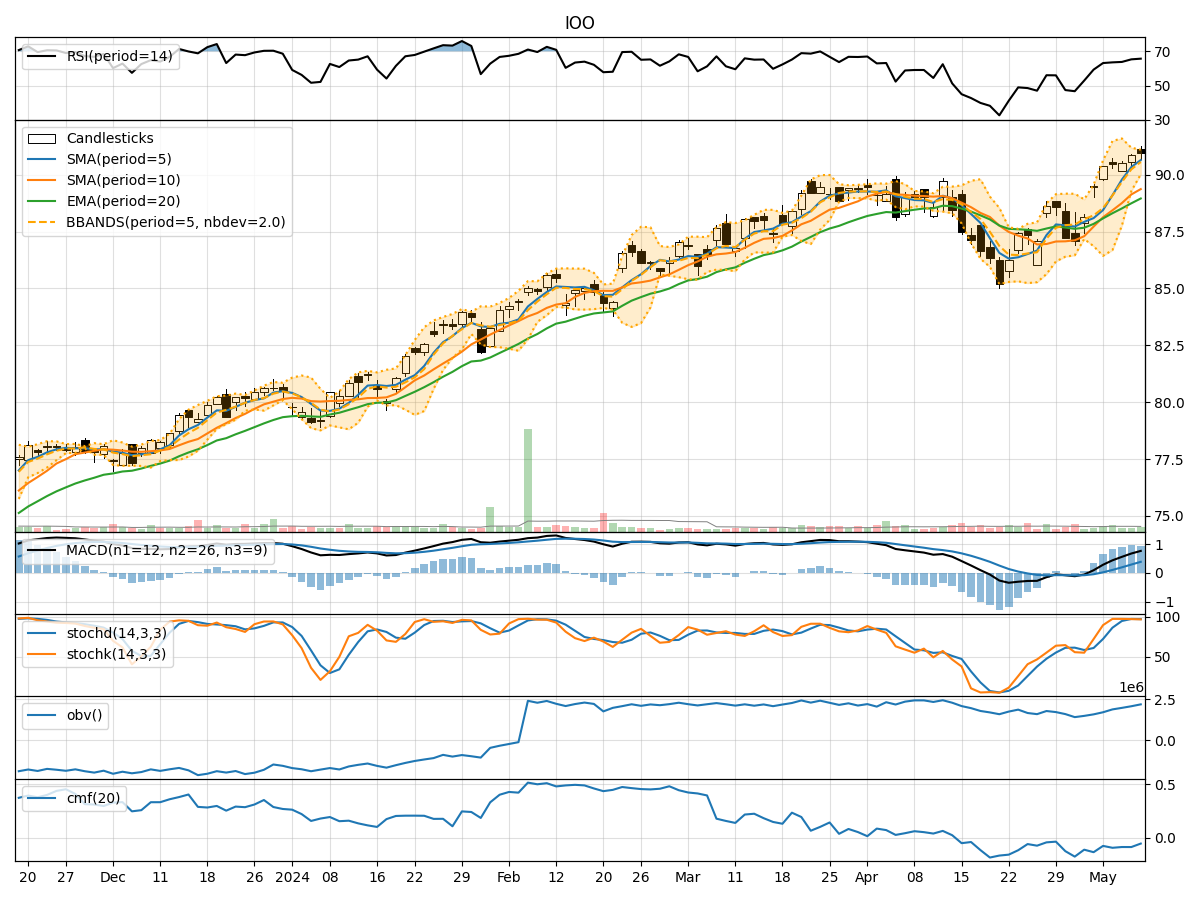
In the last 5 trading days, the stock price of IOO has shown a consistent uptrend based on various technical indicators. The Moving Average Convergence Divergence (MACD) and Relative Strength Index (RSI) have been increasing, indicating positive momentum. The Bollinger Bands have been expanding, suggesting increased volatility. However, the On-Balance Volume (OBV) has been fluctuating, indicating mixed sentiment among investors.
Trend Indicators Analysis:
- Moving Averages (MA): The 5-day MA has been consistently above the longer-term SMAs and EMAs, indicating a strong uptrend.
- MACD: The MACD line has been above the signal line, with both lines trending upwards, signaling a bullish momentum.
Key Observation: The trend indicators suggest a strong bullish trend in the stock price of IOO.
Momentum Indicators Analysis:
- RSI: The RSI has been increasing and is in the overbought territory, indicating strong buying momentum.
- Stochastic Oscillator: Both %K and %D have been in the overbought zone, suggesting a potential reversal.
Key Observation: Momentum indicators point towards a strong buying sentiment but also indicate a possibility of a pullback due to overbought conditions.
Volatility Indicators Analysis:
- Bollinger Bands (BB): The bands have been widening, indicating increased volatility in the stock price.
Key Observation: The expanding Bollinger Bands suggest that the stock price of IOO may experience larger price swings in the near future.
Volume Indicators Analysis:
- On-Balance Volume (OBV): The OBV has been fluctuating, showing mixed buying and selling pressure.
- Chaikin Money Flow (CMF): The CMF has been negative, indicating a lack of buying pressure.
Key Observation: Volume indicators reflect indecision among market participants, with no clear direction in terms of buying or selling pressure.
Conclusion:
Based on the analysis of the technical indicators, the next few days' possible stock price movement for IOO is likely to continue in an upward direction. The strong bullish trend indicated by the trend indicators and positive momentum suggested by the RSI and MACD support this view. However, the overbought conditions highlighted by the momentum indicators and the mixed sentiment in volume indicators suggest a potential for a short-term pullback or consolidation before the uptrend resumes.
Recommendation:
- Short-term Traders: Consider taking profits or setting tight stop-loss orders to protect gains in case of a pullback.
- Long-term Investors: Hold onto positions and use any potential pullback as a buying opportunity to add to positions in IOO.
Disclaimer:
Remember that market conditions can change rapidly, and it is essential to monitor the stock price movement closely and adjust your strategy accordingly. Technical analysis provides insights into potential price movements, but it is not a guarantee of future performance. Conduct thorough research and consider other fundamental factors before making investment decisions.