Technical Analysis of IOPP 2024-05-10
Overview:
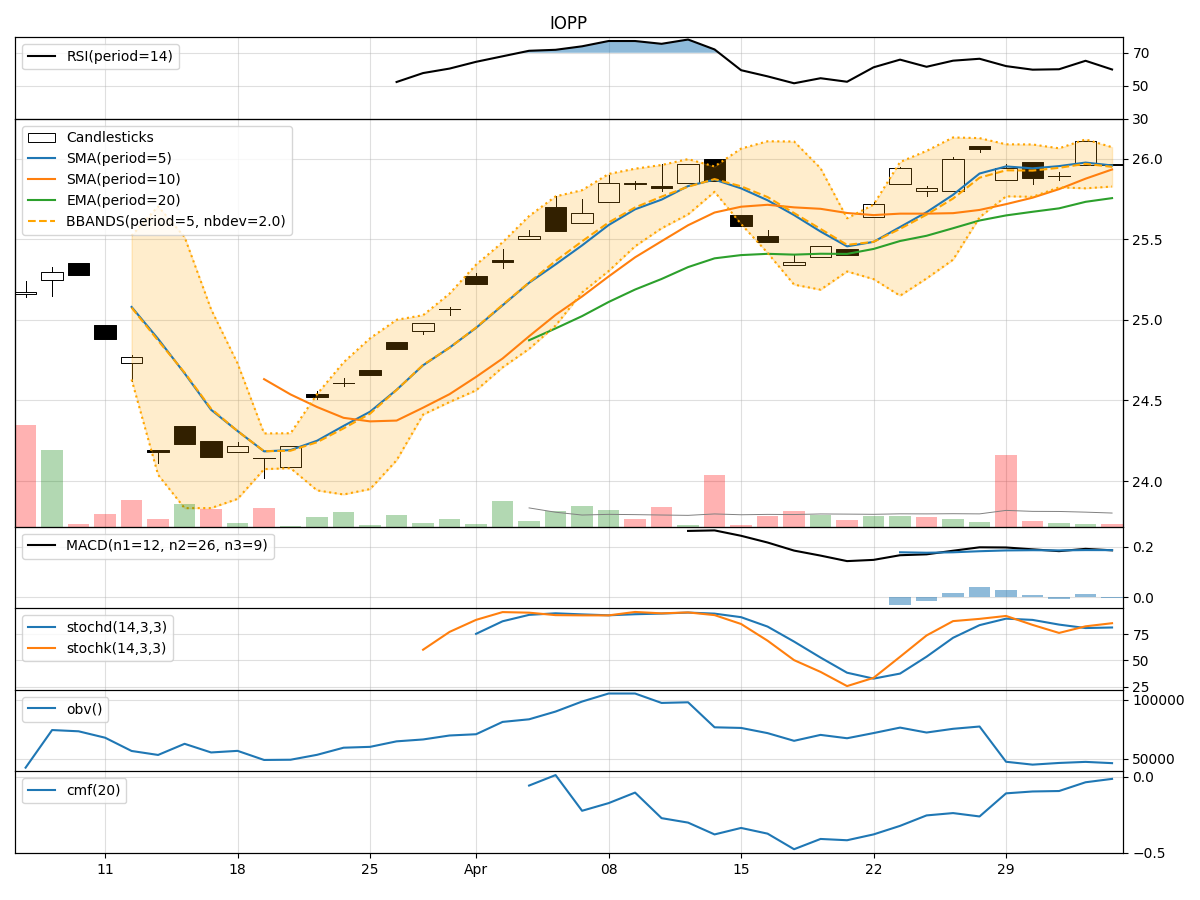
In analyzing the technical indicators for IOPP stock over the last 5 days, we will delve into the trends, momentum, volatility, and volume indicators to provide a comprehensive outlook on the possible stock price movement in the coming days. By examining key metrics such as moving averages, MACD, RSI, Bollinger Bands, and OBV, we aim to offer valuable insights and predictions for potential price action.
Trend Indicators:
- Moving Averages (MA): The 5-day MA has been gradually decreasing, indicating a short-term bearish trend.
- MACD: The MACD line has been consistently positive, but the MACD histogram has been decreasing, suggesting a potential weakening of bullish momentum.
- EMA: The EMA has been relatively stable, reflecting a neutral to slightly bearish sentiment.
Momentum Indicators:
- RSI: The RSI has been fluctuating around the 50 level, indicating a lack of strong momentum in either direction.
- Stochastic Oscillator: Both %K and %D have been declining, signaling a potential shift towards oversold conditions.
- Williams %R: The indicator has been consistently in oversold territory, suggesting a bearish sentiment.
Volatility Indicators:
- Bollinger Bands: The stock price has been trading within the bands, indicating a period of consolidation.
- Bollinger %B: The %B indicator has been hovering around the middle range, reflecting a neutral stance on volatility.
Volume Indicators:
- On-Balance Volume (OBV): The OBV has been declining, indicating selling pressure in the stock.
- Chaikin Money Flow (CMF): The CMF has been negative, suggesting a lack of buying interest.
Key Observations:
- The stock is currently in a consolidation phase, as indicated by the narrowing Bollinger Bands and lack of clear trend direction.
- Momentum indicators show a lack of strong bullish momentum, with stochastic and Williams %R pointing towards oversold conditions.
- Volume indicators suggest a decrease in buying interest, with OBV showing a downward trend.
Conclusion:
Based on the analysis of the technical indicators, the next few days for IOPP stock are likely to see sideways movement with a bearish bias. The stock is expected to continue trading within a range, with a potential downside risk due to the weakening momentum and selling pressure indicated by volume indicators. Traders should exercise caution and consider waiting for clearer signals before making any significant trading decisions.