Technical Analysis of IPAC 2024-05-10
Overview:
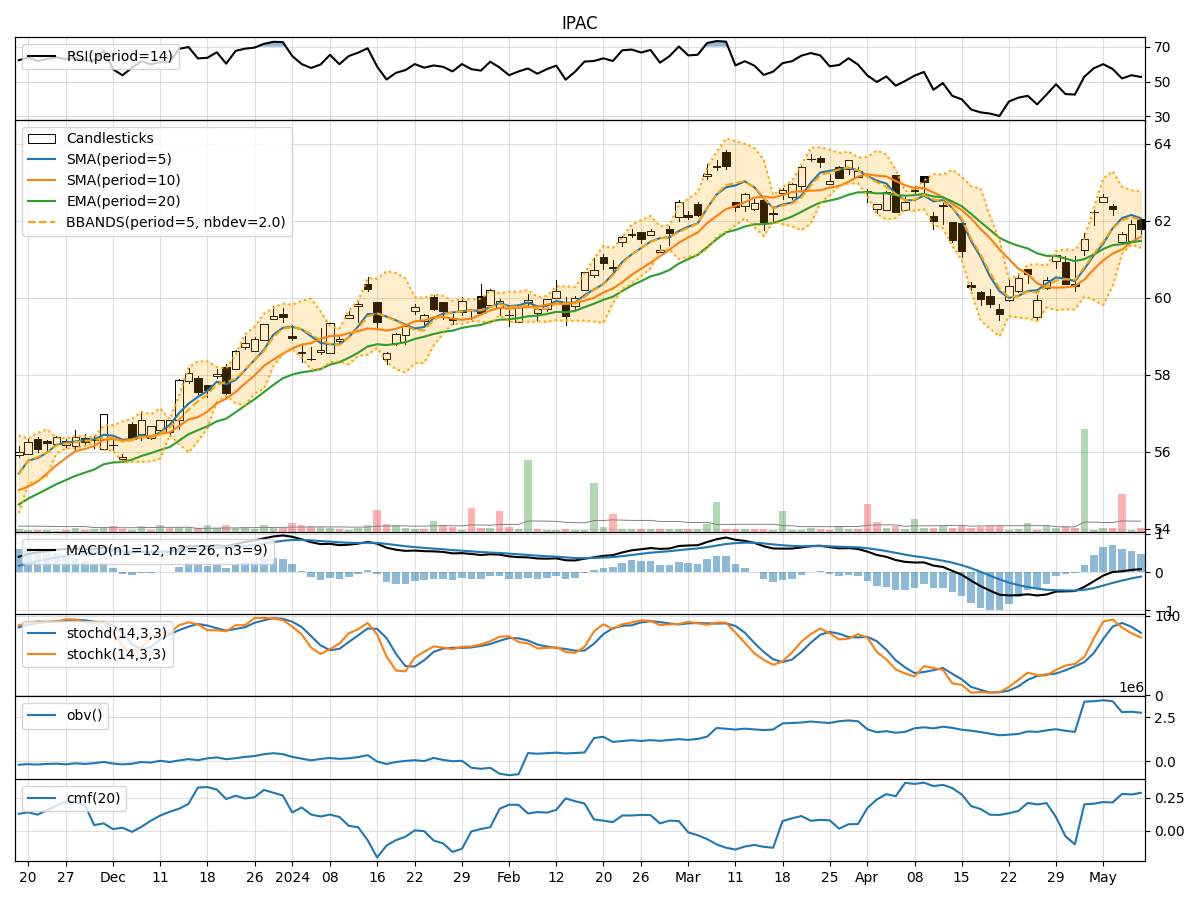
In analyzing the technical indicators for IPAC over the last 5 days, we will delve into the trend, momentum, volatility, and volume indicators to provide a comprehensive outlook on the possible stock price movement in the coming days. By examining these key indicators, we aim to offer valuable insights and predictions for informed decision-making.
Trend Indicators:
- Moving Averages (MA): The 5-day MA has been consistently above the 10-day SMA, indicating a short-term bullish trend. The EMA(20) has shown a slight upward trajectory, suggesting a positive momentum in the stock price.
- MACD: The MACD line has been above the signal line for the past few days, indicating a bullish trend. The MACD histogram has been gradually decreasing but remains in positive territory, signaling a potential slowdown in the bullish momentum.
Momentum Indicators:
- RSI: The RSI has been fluctuating around the overbought territory, indicating a strong bullish momentum in the stock. However, there are signs of potential divergence as the RSI has not made new highs along with the stock price.
- Stochastic Oscillator: Both %K and %D have been gradually decreasing, suggesting a potential shift towards a bearish momentum. The stock is currently in the overbought zone, indicating a possible reversal in the near term.
Volatility Indicators:
- Bollinger Bands (BB): The stock price has been trading within the upper Bollinger Band, indicating an overbought condition. The narrowing of the bands suggests a potential decrease in volatility and a consolidation phase.
- Bollinger %B: The %B indicator is above 0.8, signaling an overbought condition. A reversal or correction may be imminent as the stock price reaches extreme levels of volatility.
Volume Indicators:
- On-Balance Volume (OBV): The OBV has been relatively stable over the past few days, indicating a balance between buying and selling pressure. This suggests a neutral stance in terms of volume accumulation.
- Chaikin Money Flow (CMF): The CMF(20) has shown a slight increase, indicating a positive inflow of money into the stock. However, the overall trend is not strongly bullish, suggesting a cautious approach.
Conclusion:
Based on the analysis of the technical indicators, the stock of IPAC is currently exhibiting signs of overbought conditions and potential bearish divergence in momentum indicators. The narrowing Bollinger Bands and decreasing Stochastic Oscillator %K and %D further support a possible reversal or correction in the stock price in the coming days. Traders and investors should exercise caution and consider taking profits or implementing risk management strategies in anticipation of a downward movement in the stock price.