Technical Analysis of IPOS 2024-05-10
Overview:
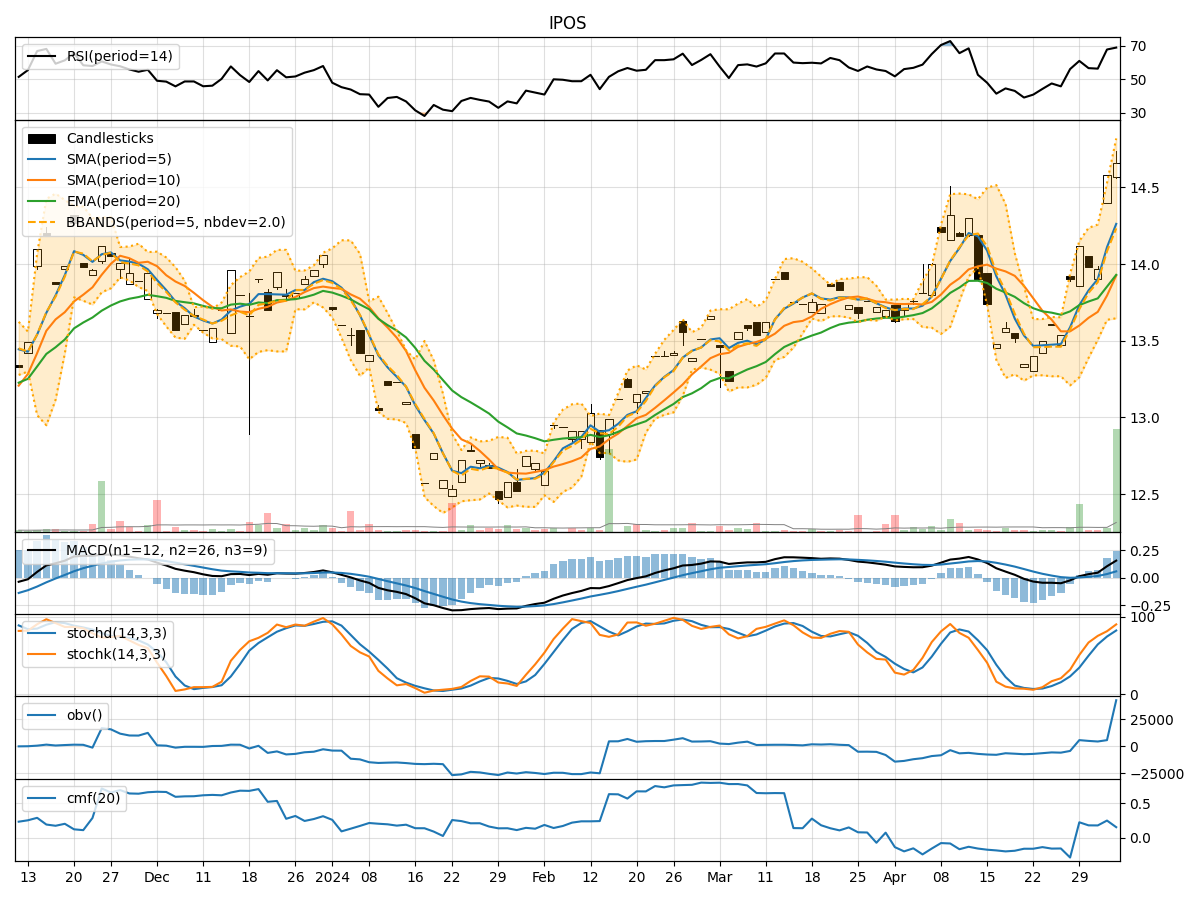
In analyzing the provided Technical Analysis (TA) data for IPOS over the last 5 trading days, we will delve into the trend, momentum, volatility, and volume indicators to derive insights into the possible future stock price movement. By examining these key indicators, we aim to provide a comprehensive and well-informed prediction for the upcoming days.
Trend Analysis:
- Moving Averages (MA): The 5-day Moving Average (MA) has been consistently above the Simple Moving Average (SMA) and Exponential Moving Average (EMA) over the past 5 days, indicating a bullish trend.
- MACD: The Moving Average Convergence Divergence (MACD) has shown positive values, with the MACD line consistently above the Signal line, suggesting bullish momentum in the stock price.
Momentum Analysis:
- RSI: The Relative Strength Index (RSI) has been fluctuating around the 60-70 range, indicating a neutral momentum in the stock.
- Stochastic Oscillator: The Stochastic Oscillator has been gradually decreasing, moving towards the oversold territory, signaling a potential reversal in the stock price.
Volatility Analysis:
- Bollinger Bands (BB): The Bollinger Bands have shown a narrowing of the bands, indicating decreasing volatility in the stock price.
Volume Analysis:
- On-Balance Volume (OBV): The OBV has been relatively stable over the past 5 days, suggesting a balanced accumulation and distribution of the stock.
- Chaikin Money Flow (CMF): The CMF has been positive, indicating buying pressure in the stock.
Key Observations:
- The trend indicators suggest a bullish sentiment in the stock price, supported by the positive MACD values.
- Momentum indicators show a neutral stance with a slight bearish bias as the Stochastic Oscillator moves towards oversold levels.
- Volatility has been decreasing, indicating a potential period of consolidation or a narrowing price range.
- Volume indicators reflect a balanced accumulation and distribution of the stock with a positive CMF.
Conclusion:
Based on the analysis of the technical indicators, the next few days' possible stock price movement for IPOS is likely to be sideways with a slight bearish bias. The bullish trend indicated by the moving averages and MACD may face resistance due to the neutral momentum and decreasing volatility. Traders should watch for potential reversal signals as the Stochastic Oscillator approaches oversold levels. Overall, a cautious approach is recommended, considering the mixed signals from the various indicators.
Disclaimer:
This analysis is based solely on the provided TA data and does not take into account fundamental factors or external market influences. It is essential to conduct thorough research and consider multiple indicators before making any investment decisions. Consulting with a financial advisor is recommended for personalized investment advice tailored to individual risk tolerance and financial goals.