Technical Analysis of IPPP 2024-05-10
Overview:
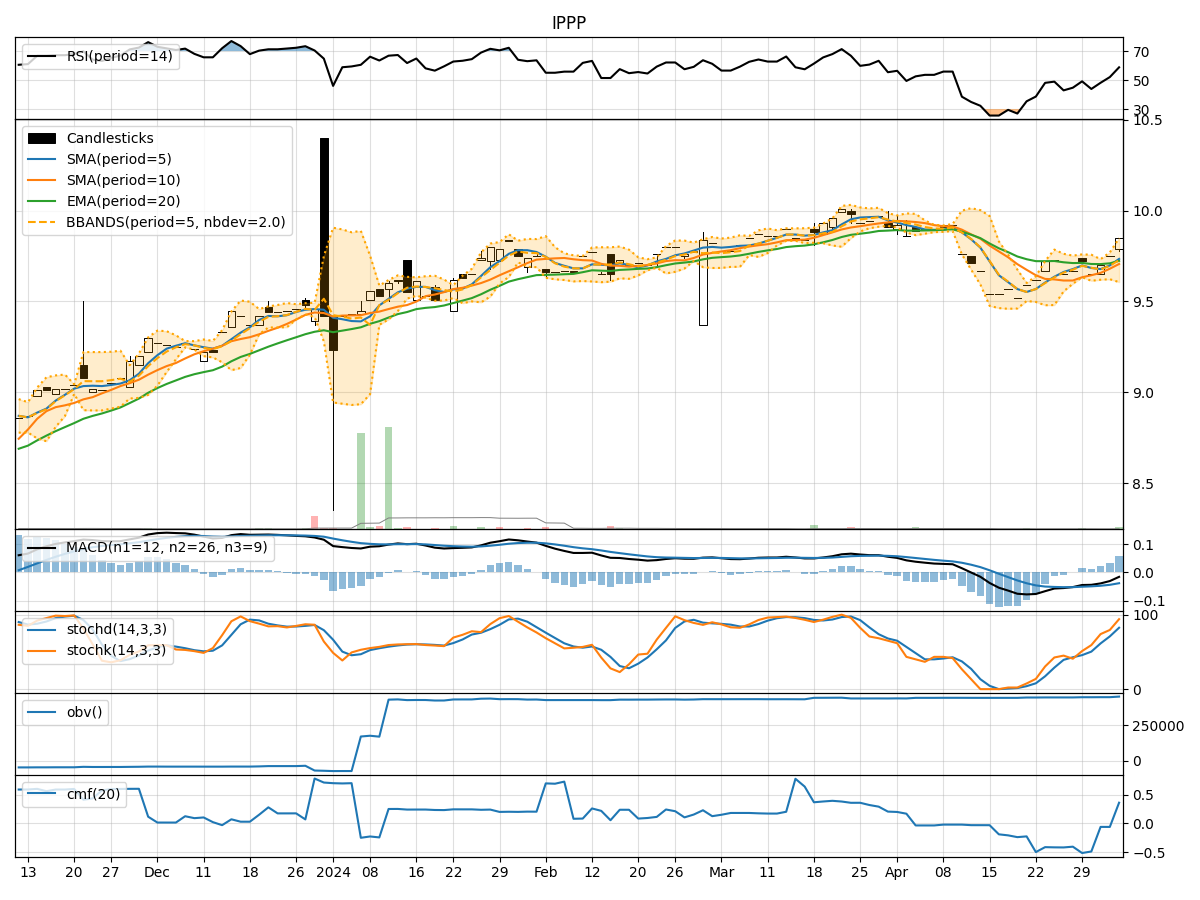
In analyzing the technical indicators for IPPP stock over the last 5 days, we will delve into the trend, momentum, volatility, and volume indicators to provide a comprehensive outlook on the possible stock price movement in the coming days. By examining key metrics such as moving averages, MACD, RSI, Bollinger Bands, and OBV, we aim to offer valuable insights and predictions for potential investors.
Trend Analysis:
- Moving Averages (MA): The 5-day MA has been consistently above the closing price, indicating a short-term uptrend.
- MACD: The MACD line has been positive and above the signal line, suggesting bullish momentum.
- EMA: The EMA has been trending upwards, supporting the bullish sentiment.
Momentum Analysis:
- RSI: The RSI has been fluctuating around the 50 level, indicating a neutral momentum.
- Stochastic Oscillator: Both %K and %D have been declining, signaling a potential reversal in momentum.
- Williams %R: The indicator has been hovering in the oversold territory, suggesting a possible buying opportunity.
Volatility Analysis:
- Bollinger Bands: The stock price has been trading within the bands, indicating a period of consolidation.
- Bollinger %B: The %B value has been fluctuating around 0.5, reflecting a balanced volatility.
- Bollinger Band Width: The band width has been narrowing, suggesting a potential breakout or significant price movement.
Volume Analysis:
- On-Balance Volume (OBV): The OBV has been relatively flat, indicating a lack of significant buying or selling pressure.
- Chaikin Money Flow (CMF): The CMF has been close to zero, reflecting a neutral money flow.
Conclusion:
Based on the analysis of the technical indicators, the stock is currently in a consolidation phase with neutral momentum and volatility. The moving averages and MACD signal a bullish bias, while the stochastic oscillator and Williams %R suggest a potential reversal in momentum. The Bollinger Bands narrowing indicates an impending breakout or significant price movement.
Recommendation:
Considering the overall technical picture, there is a possibility of a bullish breakout in the coming days. Investors should closely monitor the price action and look for confirmation signals such as a decisive move above the upper Bollinger Band or a sustained increase in trading volume to validate the bullish thesis. It is advisable to set appropriate stop-loss levels to manage risk effectively.