Technical Analysis of IQDE 2024-05-10
Overview:
In analyzing the technical indicators for IQDE stock over the last 5 days, we will delve into the trend, momentum, volatility, and volume indicators to provide a comprehensive outlook on the possible stock price movement in the coming days.
Trend Indicators:
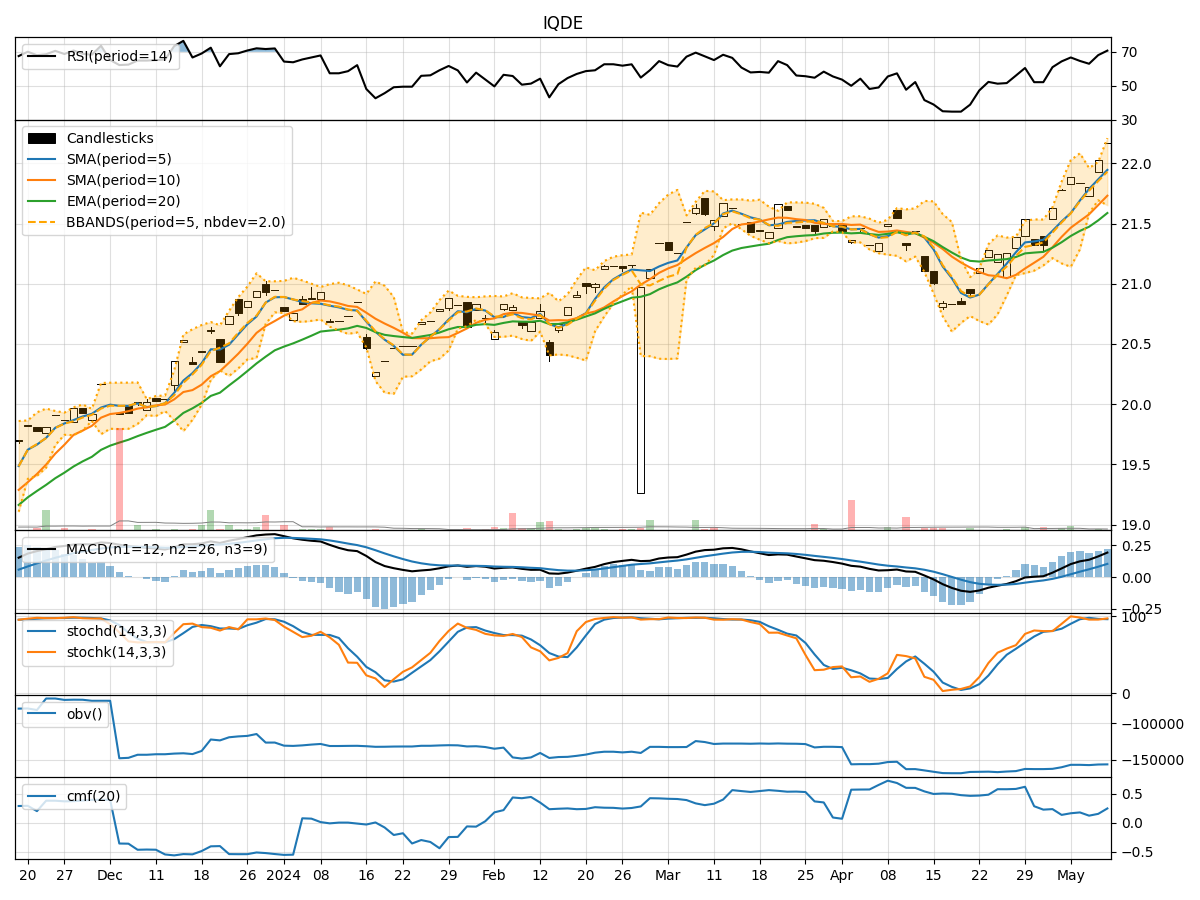
- Moving Averages (MA): The 5-day moving average has been consistently above the 10-day simple moving average, indicating a short-term bullish trend.
- Exponential Moving Average (EMA): The EMA has been trending upwards, suggesting a positive momentum in the stock price.
- Moving Average Convergence Divergence (MACD): The MACD line has been above the signal line, indicating a bullish signal.
Momentum Indicators:
- Relative Strength Index (RSI): RSI has been fluctuating in the overbought territory, indicating strong buying momentum.
- Stochastic Oscillator: Both %K and %D have been in the overbought zone, suggesting a potential reversal or consolidation.
- Williams %R (Willams %R): The Williams %R has been hovering around the oversold territory, indicating a potential buying opportunity.
Volatility Indicators:
- Bollinger Bands (BB): The stock price has been trading within the Bollinger Bands, with the bands narrowing, indicating decreasing volatility.
Volume Indicators:
- On-Balance Volume (OBV): The OBV has been fluctuating, indicating mixed buying and selling pressure.
- Chaikin Money Flow (CMF): The CMF has been positive, suggesting a bullish money flow into the stock.
Key Observations and Opinions:
- Trend: The trend indicators suggest a bullish sentiment in the short term.
- Momentum: The momentum indicators show mixed signals with potential for a reversal or consolidation.
- Volatility: Volatility has been decreasing, indicating a possible period of consolidation.
- Volume: The volume indicators reflect mixed buying and selling pressure.
Conclusion:
Based on the analysis of the technical indicators, the next few days' possible stock price movement for IQDE is likely to be sideways with a slight bullish bias. Traders should monitor the stochastic oscillator for potential reversal signals and the RSI for overbought conditions. Additionally, keeping an eye on the OBV for any significant shifts in buying or selling pressure would be crucial in determining the stock's future direction. It is advisable to wait for clearer signals before making significant trading decisions.