Technical Analysis of IQDF 2024-05-10
Overview:
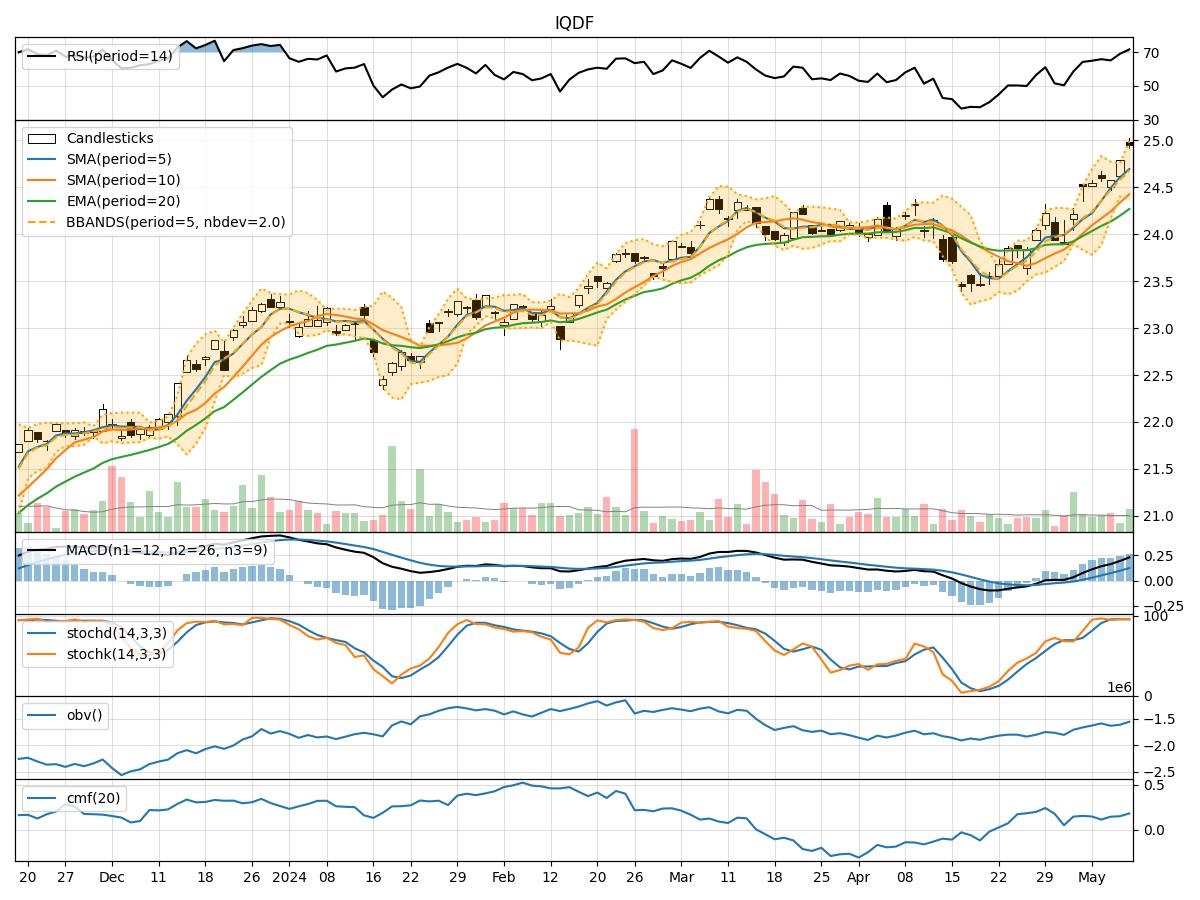
In analyzing the technical indicators for IQDF over the last 5 days, we will delve into the trend, momentum, volatility, and volume indicators to provide a comprehensive outlook on the possible stock price movement in the coming days.
Trend Indicators:
- Moving Averages (MA): The 5-day MA has been consistently above the closing prices, indicating a bullish trend.
- MACD: The MACD line has been above the signal line, suggesting a bullish momentum.
- EMA: The EMA has been trending upwards, supporting the bullish sentiment.
Momentum Indicators:
- RSI: The RSI has been in the overbought territory, indicating a strong bullish momentum.
- Stochastic Oscillator: Both %K and %D have been in the overbought zone, signaling a potential reversal.
- Williams %R: The indicator has been in the oversold region, suggesting a possible bullish reversal.
Volatility Indicators:
- Bollinger Bands (BB): The stock price has been trading within the bands, indicating moderate volatility.
- BB Width: The bands have shown slight contraction, suggesting a potential decrease in volatility.
Volume Indicators:
- On-Balance Volume (OBV): The OBV has been fluctuating, indicating indecision among investors.
- Chaikin Money Flow (CMF): The CMF has been positive, suggesting buying pressure in the stock.
Key Observations:
- The trend indicators point towards a bullish sentiment with moving averages and MACD supporting an upward trend.
- Momentum indicators show a strong bullish momentum, but the stochastic oscillator signals a potential reversal.
- Volatility indicators suggest moderate volatility with a slight contraction in Bollinger Bands width.
- Volume indicators reflect mixed signals with OBV fluctuating and CMF indicating buying pressure.
Conclusion:
Based on the analysis of technical indicators, the stock of IQDF is likely to experience a continuation of the bullish trend in the near term. However, caution is advised as the stochastic oscillator indicates a potential reversal, and the stock is currently in the overbought territory according to RSI and Williams %R. Traders should closely monitor these indicators for any signs of a reversal or consolidation.