Technical Analysis of IQDG 2024-05-10
Overview:
In analyzing the technical indicators for IQDG over the last 5 days, we will delve into the trend, momentum, volatility, and volume indicators to provide a comprehensive outlook on the possible stock price movement in the coming days. By examining these key indicators, we aim to offer valuable insights and predictions for potential investors.
Trend Analysis:
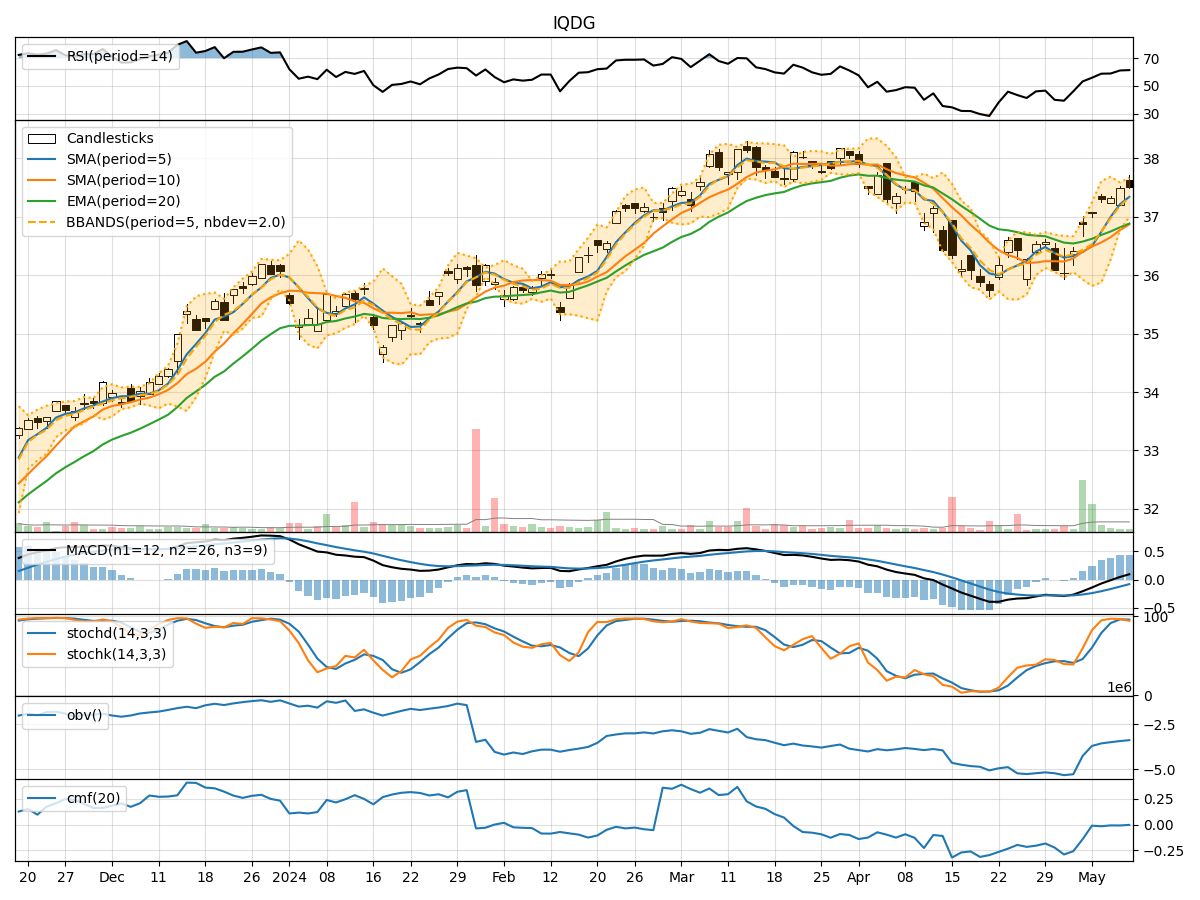
- Moving Averages (MA): The 5-day MA has been consistently above the 10-day SMA, indicating a short-term bullish trend.
- MACD: The MACD line has been consistently above the signal line, suggesting a bullish momentum.
- EMA: The EMA has been trending upwards, supporting the bullish sentiment in the short to medium term.
Momentum Analysis:
- RSI: The RSI has been gradually increasing, indicating strengthening buying momentum.
- Stochastic Oscillator: Both %K and %D have been in overbought territory, suggesting a potential reversal or consolidation.
- Williams %R: The indicator has been in oversold territory, signaling a possible buying opportunity.
Volatility Analysis:
- Bollinger Bands: The stock price has been trading within the bands, indicating normal volatility.
- Bollinger %B: The %B indicator has been fluctuating around the midline, suggesting a balanced market sentiment.
Volume Analysis:
- On-Balance Volume (OBV): The OBV has been steadily increasing, indicating accumulation by investors.
- Chaikin Money Flow (CMF): The CMF has been negative, suggesting some selling pressure in the market.
Key Observations:
- The trend indicators point towards a bullish sentiment in the short to medium term.
- Momentum indicators show a mix of bullish and potential reversal signals.
- Volatility remains stable with no extreme movements.
- Volume indicators indicate a slight selling pressure despite the overall bullish trend.
Conclusion:
Based on the analysis of the technical indicators, the overall outlook for IQDG in the next few days is bullish. However, caution is advised as some momentum indicators suggest a potential reversal or consolidation. Investors should closely monitor key levels and consider risk management strategies. Expect the stock price to continue its upward trajectory with possible short-term corrections.
Disclaimer:
This analysis is based solely on technical indicators and historical data. Market conditions can change rapidly, and unforeseen events may impact stock prices. It is essential to conduct thorough research and consider other factors before making investment decisions.