Technical Analysis of IQIN 2024-05-10
Overview:
In analyzing the technical indicators for IQIN stock over the last 5 days, we will delve into the trends, momentum, volatility, and volume indicators to provide a comprehensive outlook on the possible future stock price movement. By examining these key indicators, we aim to offer valuable insights and predictions for the upcoming trading days.
Trend Analysis:
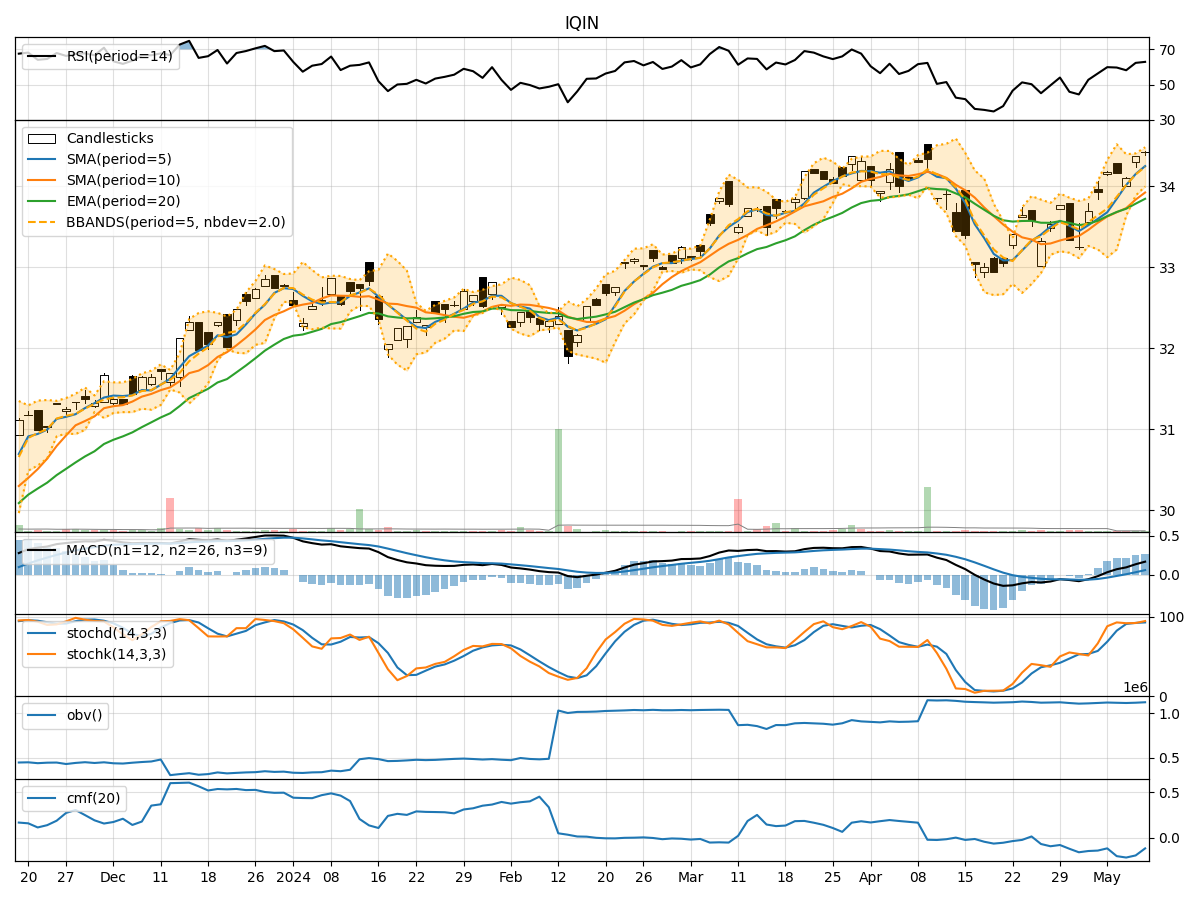
- Moving Averages (MA): The 5-day Moving Average (MA) has been consistently above the Simple Moving Average (SMA) and Exponential Moving Average (EMA), indicating a bullish trend.
- MACD: The MACD line has been consistently above the signal line, with both lines showing an upward trend, suggesting bullish momentum.
- Momentum: The Relative Strength Index (RSI) has been fluctuating around the overbought territory, indicating strong buying pressure.
- Volatility: The Bollinger Bands (BB) have been relatively narrow, suggesting low volatility in the stock price.
Key Observations:
- The stock is in an upward trend based on moving averages and MACD.
- Momentum indicators like RSI show strong buying pressure.
- Volatility is low, as indicated by narrow Bollinger Bands.
Conclusion:
Based on the analysis of trend, momentum, volatility, and volume indicators, the next few days for IQIN stock are likely to see continued upward movement. The bullish trend supported by moving averages and MACD, coupled with strong buying pressure indicated by RSI, suggests that the stock price is poised for further gains. Additionally, the low volatility environment implies a stable uptrend without significant fluctuations.
Recommendation:
Considering the overall bullish outlook, investors may consider buying or holding positions in IQIN stock for potential capital appreciation. It is essential to monitor the indicators closely for any signs of reversal or increased volatility that may impact trading decisions. As always, risk management strategies should be in place to mitigate potential downside risks.
By leveraging the insights from technical analysis and understanding the interplay of various indicators, investors can make informed decisions aligned with market dynamics and trends.