Technical Analysis of IQLT 2024-05-10
Overview:
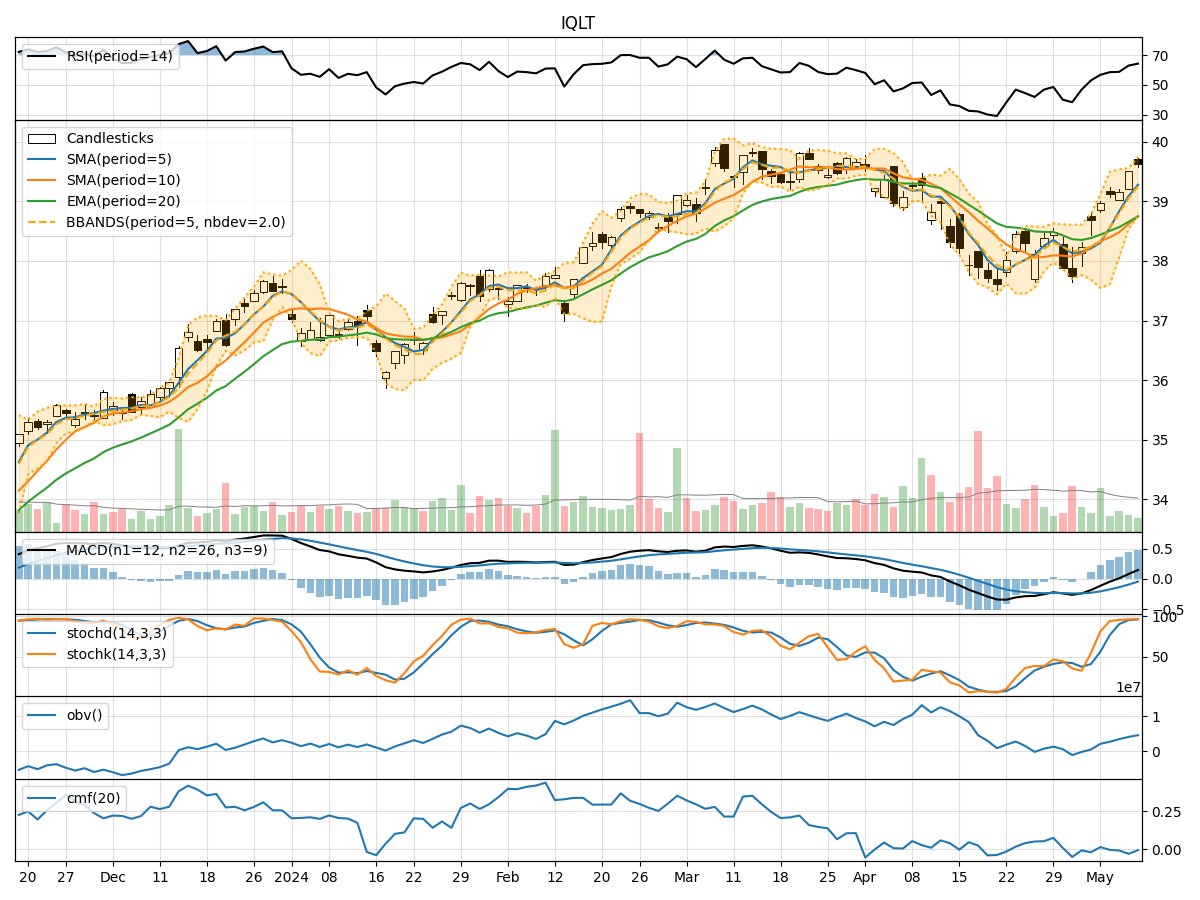
In analyzing the technical indicators for IQLT over the last 5 days, we will delve into the trend, momentum, volatility, and volume indicators to provide a comprehensive outlook on the possible stock price movement in the coming days.
Trend Analysis:
- Moving Averages (MA): The 5-day Moving Average has been consistently above the Simple Moving Average (SMA) and Exponential Moving Average (EMA), indicating a bullish trend.
- MACD: The MACD line has been consistently above the signal line, with the MACD Histogram showing an increasing positive trend, suggesting bullish momentum.
Momentum Analysis:
- RSI: The Relative Strength Index (RSI) has been trending upwards and is currently in the overbought territory, indicating strong buying momentum.
- Stochastic Oscillator: Both %K and %D lines of the Stochastic Oscillator are in the overbought zone, suggesting a potential reversal or consolidation.
Volatility Analysis:
- Bollinger Bands: The stock price has been trading within the Bollinger Bands, with the bands narrowing, indicating decreasing volatility.
- Bollinger %B: The %B indicator is hovering around 0.8, suggesting the stock is trading closer to the upper band.
Volume Analysis:
- On-Balance Volume (OBV): The OBV has been showing mixed signals, with some days experiencing negative volume divergence, indicating potential distribution.
- Chaikin Money Flow (CMF): The CMF has been negative, suggesting selling pressure in the stock.
Conclusion:
Based on the analysis of the technical indicators, the stock of IQLT is currently exhibiting strong bullish momentum supported by the moving averages and MACD. However, the overbought conditions in RSI and Stochastic Oscillator signal a potential reversal or consolidation in the short term. The narrowing Bollinger Bands indicate decreasing volatility, which could lead to a period of consolidation.
Considering the mixed signals from the volume indicators, it is essential to monitor the volume closely for confirmation of the price movement. In conclusion, while the overall trend is bullish, caution is advised due to the overbought conditions and potential consolidation. Short-term traders may consider taking profits, while long-term investors should monitor the price action for a potential entry point during a consolidation phase.