Technical Analysis of IQM 2024-05-10
Overview:
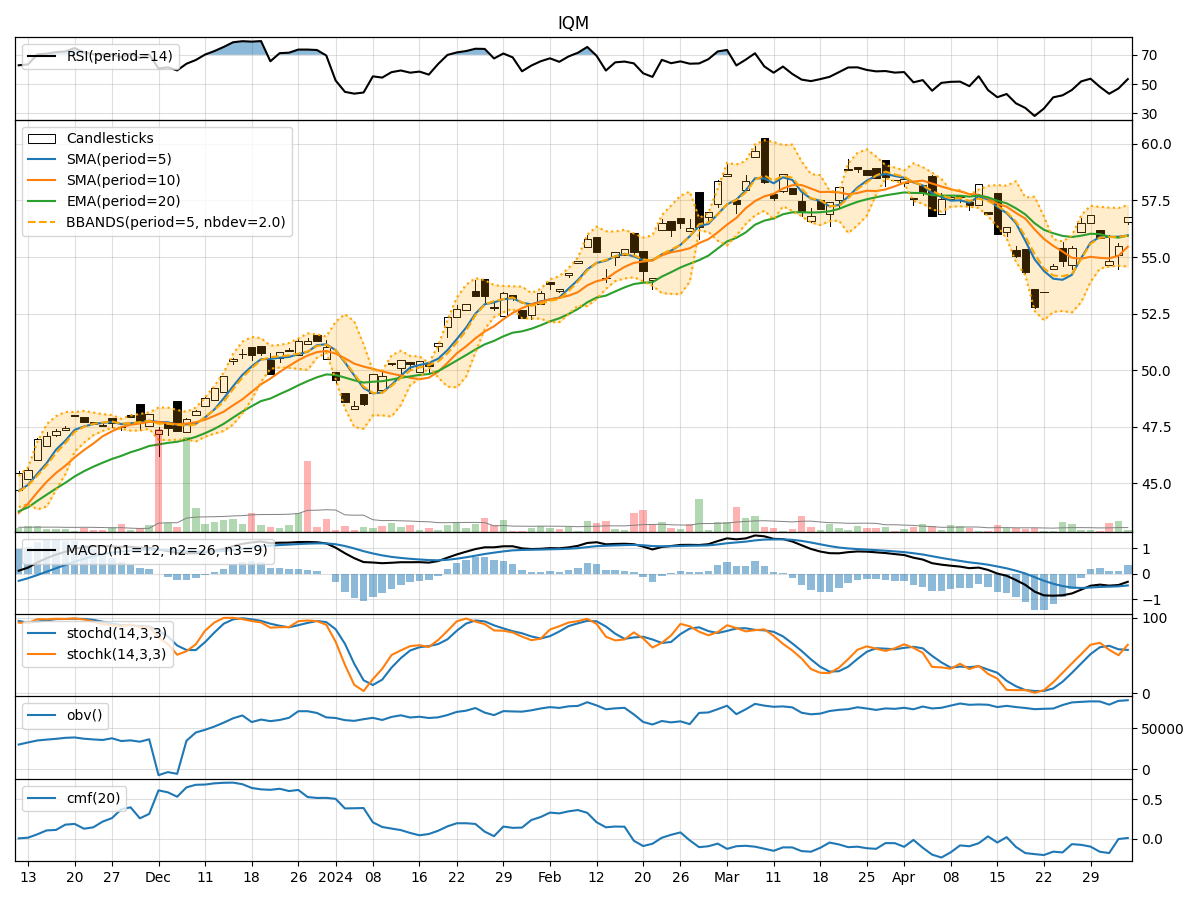
In analyzing the technical indicators for IQM stock over the last 5 days, we will delve into the trend, momentum, volatility, and volume indicators to provide a comprehensive outlook on the possible stock price movement in the coming days. By examining key metrics such as moving averages, MACD, RSI, Bollinger Bands, and OBV, we aim to offer valuable insights and predictions for potential price action.
Trend Indicators:
- Moving Averages (MA): The 5-day MA has been consistently above the closing prices, indicating a bullish trend.
- MACD: The MACD line has been above the signal line, suggesting a bullish momentum.
- EMA: The EMA has been trending upwards, supporting the bullish sentiment.
Momentum Indicators:
- RSI: The RSI has been in overbought territory, signaling a strong bullish momentum.
- Stochastic Oscillator: Both %K and %D have been high, indicating strong buying pressure.
- Williams %R: The indicator has been consistently in oversold territory, reflecting a strong bullish sentiment.
Volatility Indicators:
- Bollinger Bands (BB): The stock price has been trading close to the upper Bollinger Band, suggesting high volatility.
- BB Width: The bands have been relatively wide, indicating increased price fluctuations.
Volume Indicators:
- On-Balance Volume (OBV): The OBV has shown positive accumulation, indicating buying interest.
- Chaikin Money Flow (CMF): The CMF has been positive, reflecting strong buying pressure.
Key Observations:
- The trend indicators, momentum indicators, and volume indicators all point towards a strong bullish sentiment in the market.
- Volatility indicators suggest that the stock is experiencing high price fluctuations, potentially due to increased trading activity.
Conclusion:
Based on the analysis of the technical indicators, it is highly likely that IQM stock will continue its upward trajectory in the coming days. The bullish trend, supported by strong momentum and positive volume accumulation, indicates a favorable outlook for the stock price. Traders and investors may consider buying opportunities in anticipation of further price appreciation.