Technical Analysis of IQSI 2024-05-10
Overview:
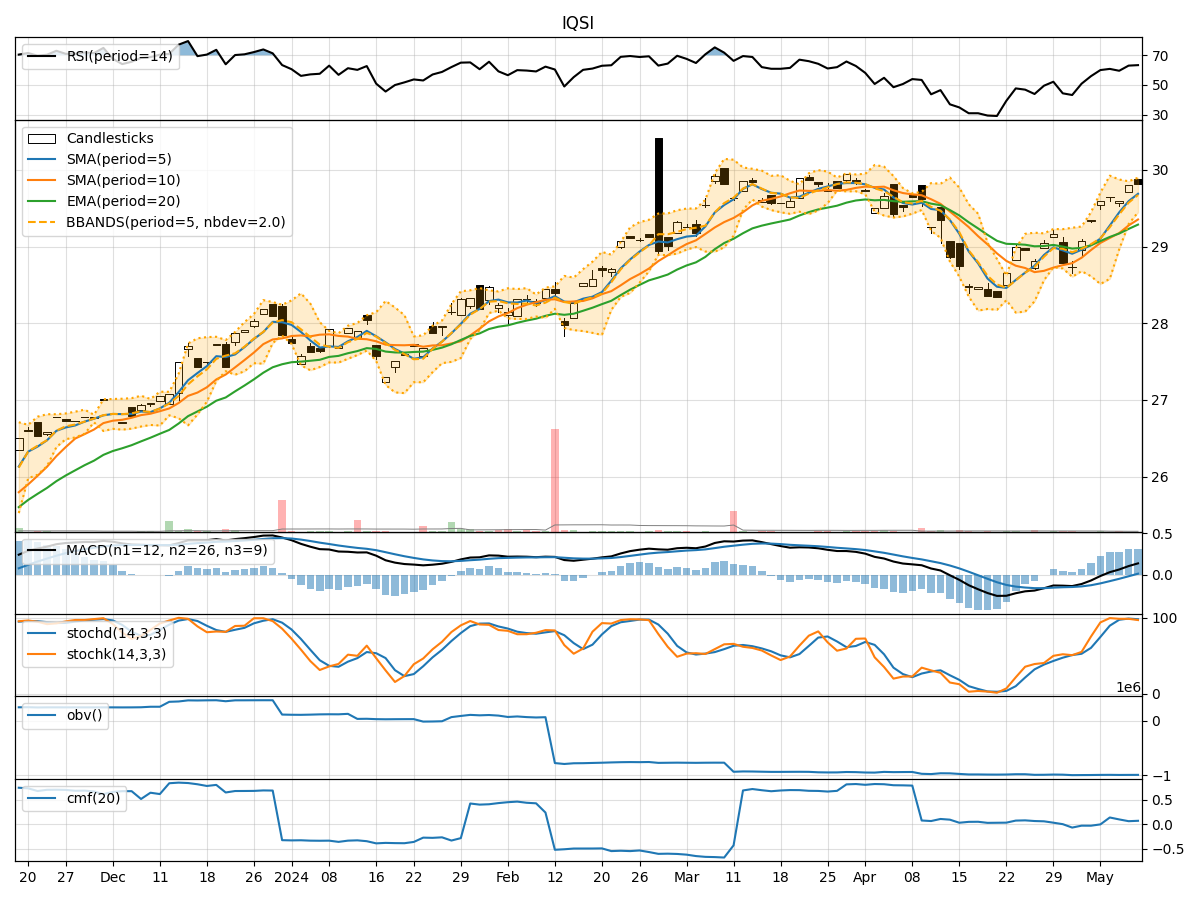
In analyzing the technical indicators for IQSI over the last 5 days, we will delve into the trend, momentum, volatility, and volume indicators to provide a comprehensive outlook on the possible stock price movement in the coming days. By examining these key aspects, we aim to offer valuable insights and predictions to guide your investment decisions.
Trend Analysis:
- Moving Averages (MA): The 5-day Moving Average (MA) has been consistently above the Simple Moving Average (SMA) and Exponential Moving Average (EMA), indicating a bullish trend.
- MACD: The Moving Average Convergence Divergence (MACD) has shown positive values, with the MACD line consistently above the Signal line, suggesting upward momentum.
Momentum Analysis:
- RSI: The Relative Strength Index (RSI) has been in the range of 60-65, indicating a balanced momentum without extreme overbought or oversold conditions.
- Stochastic Oscillator: Both %K and %D have been hovering around 98-99, signaling strong buying momentum.
Volatility Analysis:
- Bollinger Bands (BB): The stock price has been trading within the Bollinger Bands, with the bands narrowing, indicating decreasing volatility.
Volume Analysis:
- On-Balance Volume (OBV): The OBV has shown a slight decline over the last 5 days, suggesting a decrease in buying pressure.
- Chaikin Money Flow (CMF): The CMF has been positive but relatively stable, indicating a consistent inflow of money into the stock.
Key Observations:
- The trend indicators suggest a bullish sentiment, supported by positive MACD values and the MA trend.
- Momentum indicators reflect strong buying momentum, as indicated by high Stochastic %K and %D values.
- Volatility has been decreasing, with the stock price trading within the Bollinger Bands, signaling a period of consolidation.
- Volume indicators show a slight decrease in buying pressure but overall positive money flow into the stock.
Conclusion:
Based on the analysis of the technical indicators, the next few days for IQSI stock are likely to see continued upward movement. The bullish trend, strong momentum, and stable volatility indicate a favorable outlook for the stock price. Investors may consider buying or holding positions in IQSI, as the indicators point towards a potential upward trend in the coming days. It is essential to monitor the indicators closely for any signs of reversal or significant shifts in market dynamics.