Technical Analysis of IQSM 2024-05-10
Overview:
In analyzing the technical indicators for IQSM over the last 5 days, we will delve into the trend, momentum, volatility, and volume indicators to provide a comprehensive outlook on the possible stock price movement in the coming days. By examining these key aspects, we aim to offer valuable insights and predictions for informed decision-making.
Trend Indicators:
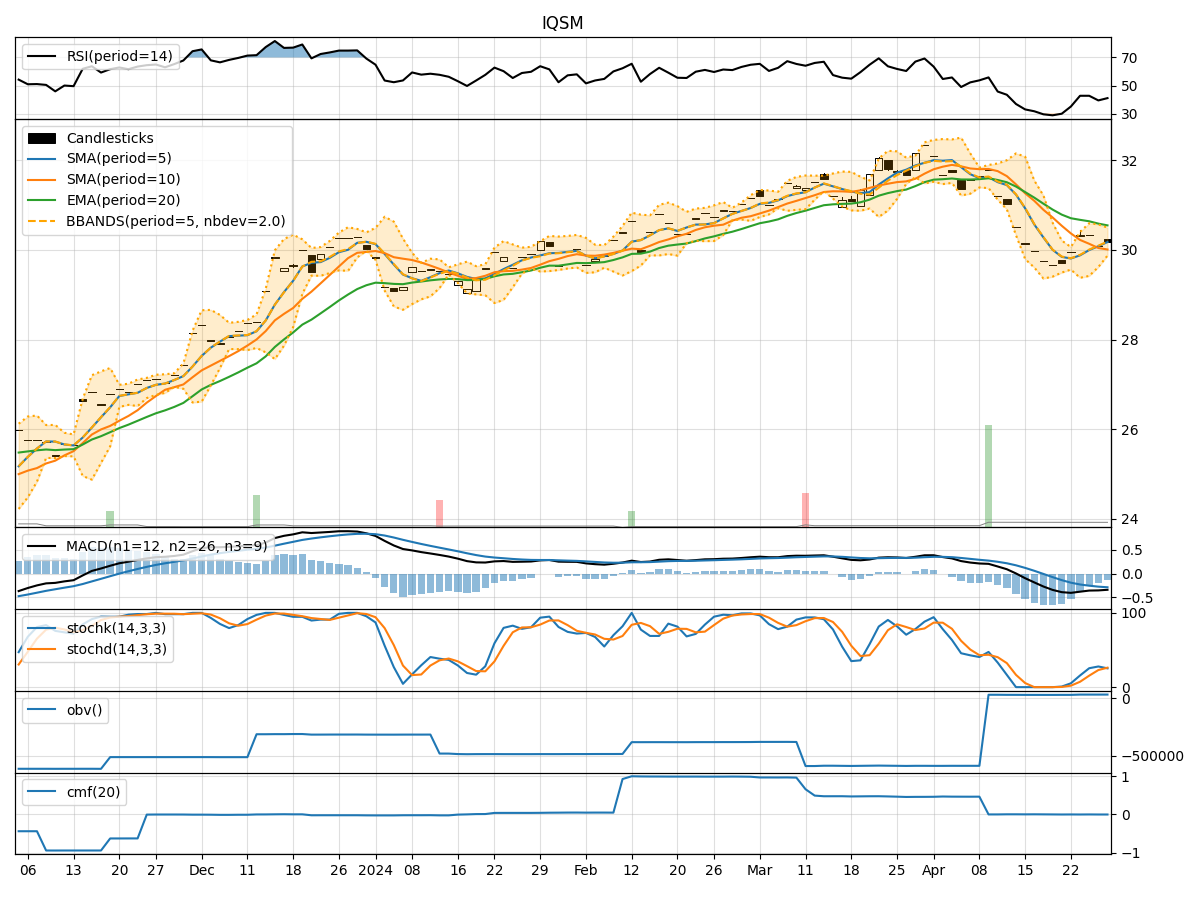
- Moving Averages (MA): The 5-day MA has been consistently above the closing prices, indicating a short-term uptrend.
- MACD: The MACD line has been negative but trending towards the signal line, suggesting a potential reversal in the short term.
- RSI: The RSI values have been fluctuating around the neutral zone, reflecting indecision in the market sentiment.
Momentum Indicators:
- Stochastic Oscillator: The stochastic indicators have been hovering in the overbought territory, signaling a potential reversal or consolidation.
- Williams %R: The Williams %R values have been fluctuating around the oversold region, indicating potential buying opportunities.
Volatility Indicators:
- Bollinger Bands: The Bollinger Bands have been narrowing, suggesting a decrease in volatility and a possible period of consolidation.
- Average True Range (ATR): The ATR values have been relatively stable, indicating consistent price movements without significant spikes.
Volume Indicators:
- On-Balance Volume (OBV): The OBV has been relatively flat, indicating a balance between buying and selling pressure.
- Chaikin Money Flow (CMF): The CMF values have been negative, suggesting outflow of money from the stock.
Key Observations:
- The trend indicators show a potential reversal in the short term, with the MACD converging towards the signal line.
- Momentum indicators indicate a mixed sentiment with stochastic oscillators in overbought territory and Williams %R fluctuating around oversold levels.
- Volatility indicators suggest a period of consolidation with narrowing Bollinger Bands.
- Volume indicators reflect a balanced market sentiment with no clear direction in buying or selling pressure.
Conclusion:
Based on the analysis of the technical indicators, the stock price of IQSM is likely to experience sideways movement in the coming days. The convergence of the MACD lines, mixed momentum signals, narrowing Bollinger Bands, and balanced volume indicators indicate a period of consolidation and indecision in the market. Traders may expect limited price fluctuations and should exercise caution in making significant trading decisions until a clear trend emerges.