Technical Analysis of IQSU 2024-05-10
Overview:
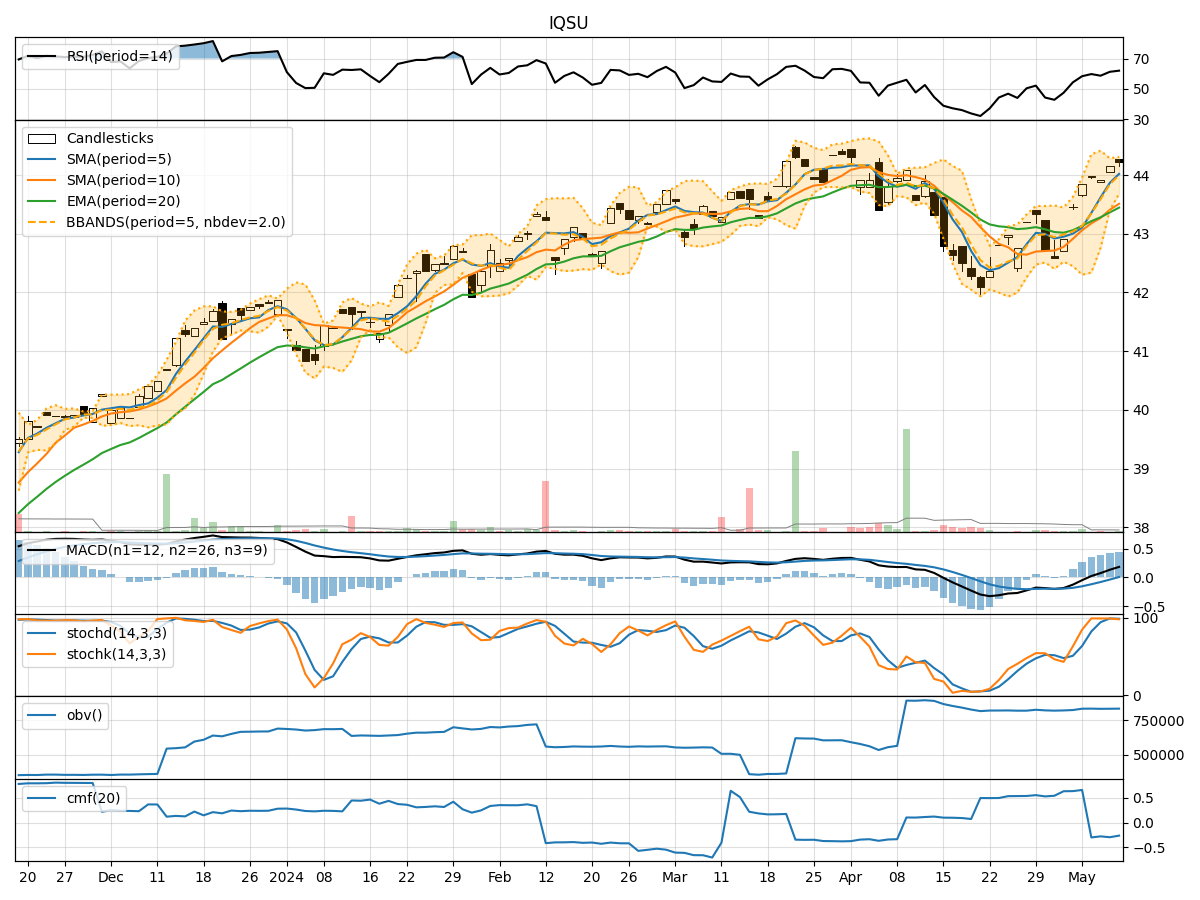
In analyzing the technical indicators for IQSU over the last 5 days, we will delve into the trend, momentum, volatility, and volume indicators to provide a comprehensive outlook on the possible stock price movement in the coming days.
Trend Indicators:
- Moving Averages (MA): The 5-day MA has been consistently above the closing prices, indicating a bullish trend.
- MACD: The MACD line has been above the signal line for the past 5 days, suggesting a bullish momentum.
- EMA: The exponential moving average has been trending upwards, supporting the bullish sentiment.
Momentum Indicators:
- RSI: The Relative Strength Index has been in the overbought territory, indicating strong buying momentum.
- Stochastic Oscillator: Both %K and %D have been in the overbought zone, signaling a strong bullish momentum.
- Williams %R: The indicator has been consistently in the oversold region, suggesting a potential reversal.
Volatility Indicators:
- Bollinger Bands: The bands have been narrowing, indicating decreasing volatility and a possible consolidation phase.
- Bollinger %B: The %B indicator has been hovering around 0.8, suggesting a bullish sentiment.
Volume Indicators:
- On-Balance Volume (OBV): The OBV has been fluctuating but has not shown a clear trend, indicating mixed buying and selling pressure.
- Chaikin Money Flow (CMF): The CMF has been negative, suggesting a bearish sentiment in the market.
Key Observations:
- The trend indicators and momentum indicators both point towards a bullish sentiment in the stock.
- Volatility indicators suggest a possible consolidation phase in the near future.
- Volume indicators show mixed signals, with OBV fluctuating and CMF indicating a bearish bias.
Conclusion:
Based on the analysis of the technical indicators, the next few days for IQSU are likely to see upward movement in the stock price, supported by the bullish trend and momentum indicators. However, the narrowing Bollinger Bands indicate a possible consolidation phase, so traders should be cautious of potential price fluctuations. The mixed signals from volume indicators suggest that the stock may face some resistance in its upward movement. Overall, the outlook for IQSU in the next few days is bullish with a possibility of consolidation.