Technical Analysis of ISCG 2024-05-10
Overview:
In analyzing the technical indicators for ISCG over the last 5 days, we will delve into the trend, momentum, volatility, and volume indicators to provide a comprehensive outlook on the possible stock price movement. By examining these key aspects, we aim to offer valuable insights and predictions for the upcoming days.
Trend Indicators:
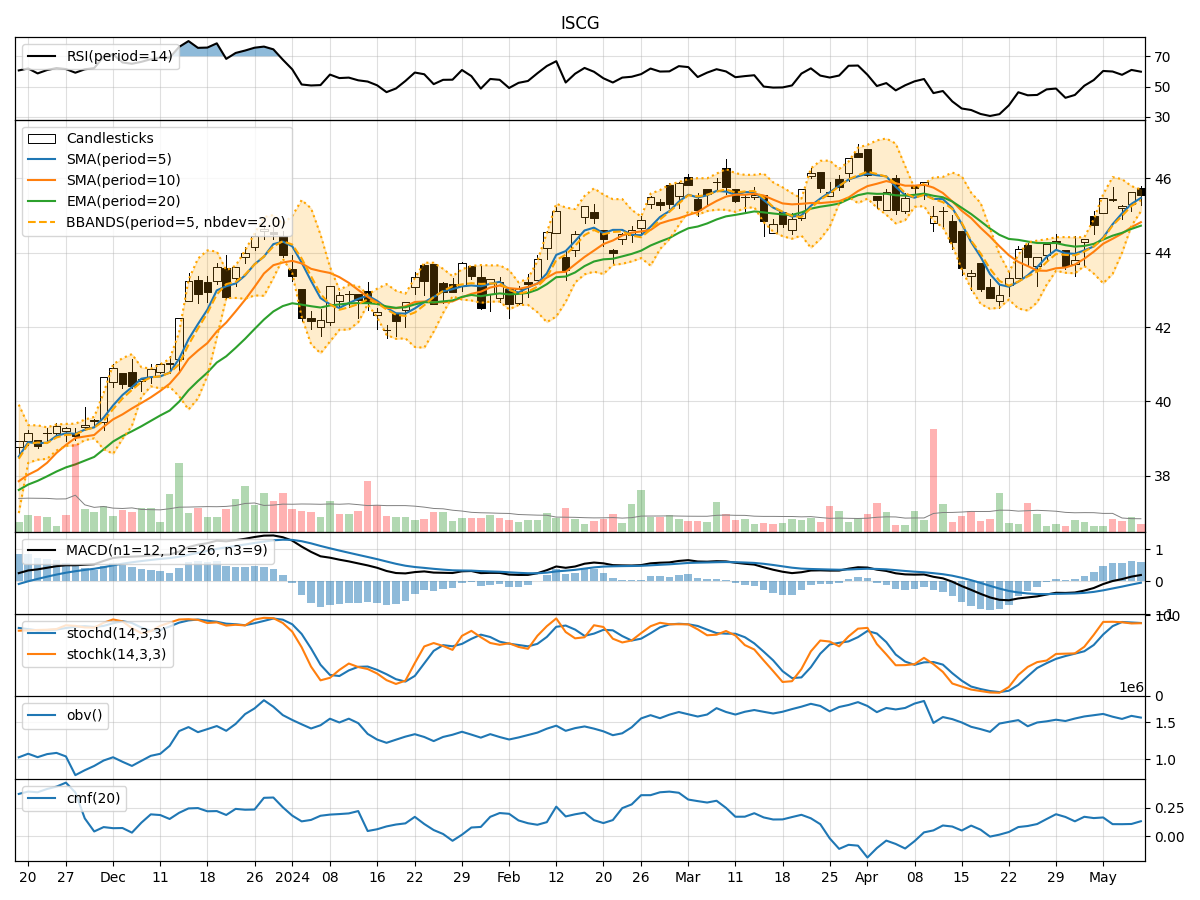
- Moving Averages (MA): The 5-day Moving Average (MA) has been consistently above the Simple Moving Average (SMA) and Exponential Moving Average (EMA), indicating a bullish trend.
- MACD: The MACD line has been consistently above the signal line, suggesting a positive momentum in the stock price.
- MACD Histogram: The MACD Histogram has been mostly positive, further supporting the bullish sentiment in the stock.
Momentum Indicators:
- RSI: The Relative Strength Index (RSI) has been fluctuating around the 60-61 range, indicating a neutral momentum.
- Stochastic Oscillator: Both %K and %D lines of the Stochastic Oscillator have been hovering around 90, suggesting an overbought condition.
- Williams %R: The Williams %R is showing oversold conditions, potentially signaling a reversal in the stock price.
Volatility Indicators:
- Bollinger Bands: The Bollinger Bands have been narrowing, indicating decreasing volatility in the stock price.
- Bollinger %B: The %B indicator has been fluctuating around 0.6-0.7, suggesting the stock is trading within the bands.
Volume Indicators:
- On-Balance Volume (OBV): The OBV has shown mixed signals, with no clear trend in volume accumulation.
- Chaikin Money Flow (CMF): The CMF has been relatively stable around 0.1, indicating a neutral money flow into the stock.
Key Observations and Opinions:
- Trend: The trend indicators suggest a bullish sentiment in the stock price, supported by the MA, MACD, and MACD Histogram.
- Momentum: The momentum indicators show conflicting signals, with the RSI neutral, Stochastic overbought, and Williams %R oversold.
- Volatility: Volatility has been decreasing, as indicated by the narrowing Bollinger Bands, potentially leading to a period of consolidation.
- Volume: Volume indicators do not provide a clear direction, indicating uncertainty in market participation.
Conclusion:
Based on the analysis of the technical indicators, the stock price of ISCG is likely to experience sideways movement in the next few days. The bullish trend signals from the trend indicators may be offset by the conflicting momentum indicators and the lack of clear volume direction. The decreasing volatility suggests a period of consolidation, with the stock price likely to trade within a range. Traders should exercise caution and wait for clearer signals before making significant trading decisions.