Technical Analysis of ISCV 2024-05-10
Overview:
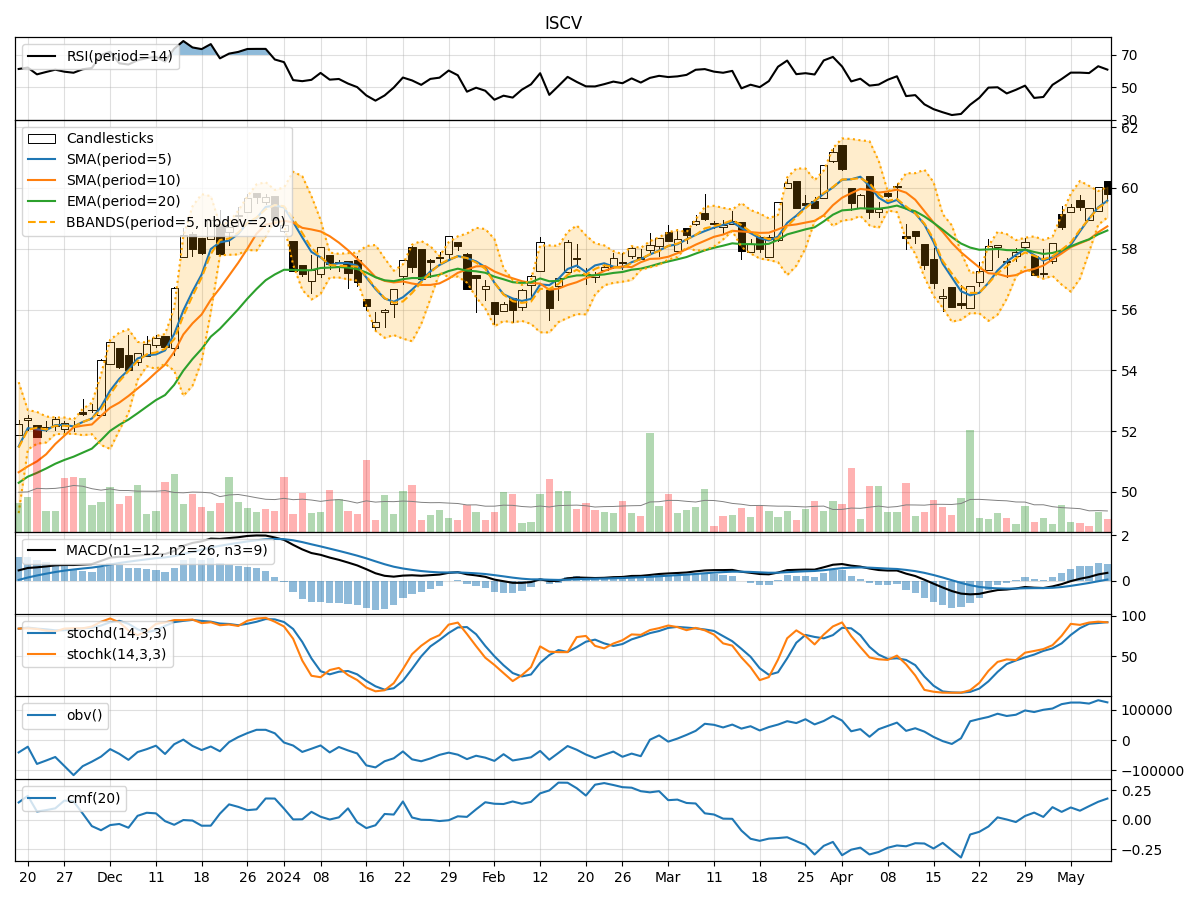
In analyzing the technical indicators for ISCV stock over the last 5 days, we will delve into the trend, momentum, volatility, and volume indicators to provide a comprehensive outlook on the possible stock price movement in the coming days. By examining these key indicators, we aim to offer valuable insights and predictions to guide your investment decisions.
Trend Analysis:
- Moving Averages (MA): The 5-day Moving Average (MA) has been consistently above the Simple Moving Average (SMA) and Exponential Moving Average (EMA), indicating a bullish trend.
- MACD: The MACD line has been consistently above the signal line, with the MACD Histogram showing positive values, suggesting a bullish momentum in the stock price.
Momentum Analysis:
- RSI: The Relative Strength Index (RSI) has been fluctuating in the overbought territory, indicating strong buying momentum.
- Stochastic Oscillator: Both %K and %D lines of the Stochastic Oscillator have been in the overbought zone, suggesting a potential reversal or consolidation.
Volatility Analysis:
- Bollinger Bands (BB): The stock price has been trading within the upper Bollinger Band (BBU), indicating an uptrend with increased volatility.
- Bollinger Band Width (BBW): The BBW has been narrowing, suggesting a potential decrease in volatility and a possible consolidation phase.
Volume Analysis:
- On-Balance Volume (OBV): The OBV indicator has shown mixed signals, with fluctuations in volume accumulation, indicating indecision among market participants.
- Chaikin Money Flow (CMF): The CMF has been positive, indicating buying pressure in the stock.
Key Observations:
- The trend indicators suggest a strong bullish sentiment in the stock price.
- Momentum indicators point towards overbought conditions, signaling a potential reversal or consolidation.
- Volatility indicators indicate an uptrend with increased volatility, potentially leading to price fluctuations.
- Volume indicators show mixed signals, reflecting uncertainty in market participation.
Conclusion:
Based on the analysis of the technical indicators, the stock price of ISCV is likely to experience further upward movement in the coming days, driven by the bullish trend and positive momentum. However, caution is advised as the stock is currently in overbought territory, indicating a potential reversal or consolidation. Traders should closely monitor price action and volume dynamics to navigate potential market shifts effectively.