Technical Analysis of ISDB 2024-05-10
Overview:
In analyzing the technical indicators for ISDB stock over the last 5 days, we will delve into the trend, momentum, volatility, and volume indicators to provide a comprehensive outlook on the possible future stock price movement. By examining these key indicators, we aim to offer valuable insights and predictions for the upcoming trading days.
Trend Analysis:
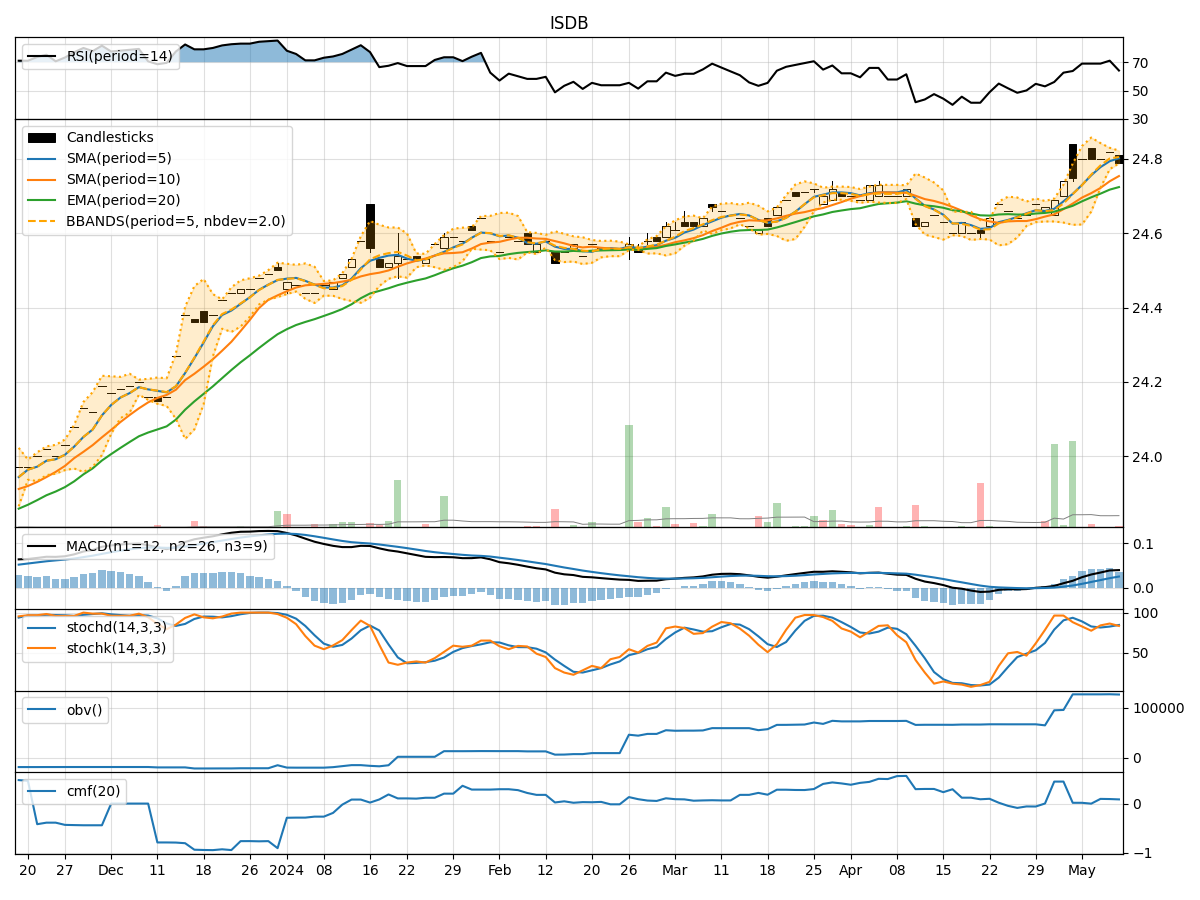
- Moving Averages (MA): The 5-day Moving Average (MA) has been steadily increasing, indicating a positive trend in the stock price.
- MACD: The MACD line has been consistently above the signal line, suggesting bullish momentum in the stock.
- RSI: The Relative Strength Index (RSI) has been fluctuating but generally staying within the neutral to overbought territory.
Key Observation: The trend indicators point towards a bullish sentiment in the stock price.
Momentum Analysis:
- Stochastic Oscillator: The Stochastic Oscillator has shown some fluctuations but has generally been in the overbought region.
- Williams %R: The Williams %R indicator has been in the oversold region, indicating potential buying opportunities.
Key Observation: Momentum indicators suggest a mixed sentiment with some overbought conditions.
Volatility Analysis:
- Bollinger Bands: The Bollinger Bands have shown narrowing bands, indicating decreasing volatility in the stock price.
Key Observation: Volatility indicators suggest a decreasing volatility environment.
Volume Analysis:
- On-Balance Volume (OBV): The OBV has shown some fluctuations but has not diverged significantly from the price movement.
- Chaikin Money Flow (CMF): The CMF has been positive, indicating buying pressure in the stock.
Key Observation: Volume indicators suggest positive buying pressure in the stock.
Conclusion:
Based on the analysis of the technical indicators, the overall outlook for ISDB stock in the next few days is bullish. The trend indicators, momentum indicators, and volume indicators collectively point towards a positive sentiment in the stock price movement. However, it is essential to monitor the momentum indicators closely for any signs of overbought conditions. Traders and investors may consider taking long positions in ISDB stock based on the current technical analysis.
Disclaimer:
This analysis is based solely on technical indicators and historical data. It is crucial to consider other fundamental factors and market dynamics before making any investment decisions. Additionally, market conditions can change rapidly, so it is advisable to continuously monitor the stock's performance and adjust strategies accordingly.