Technical Analysis of ISHP 2024-05-10
Overview:
In analyzing the technical indicators for ISHP stock over the last 5 days, we will delve into the trend, momentum, volatility, and volume indicators to provide a comprehensive outlook on the possible stock price movement in the coming days.
Trend Analysis:
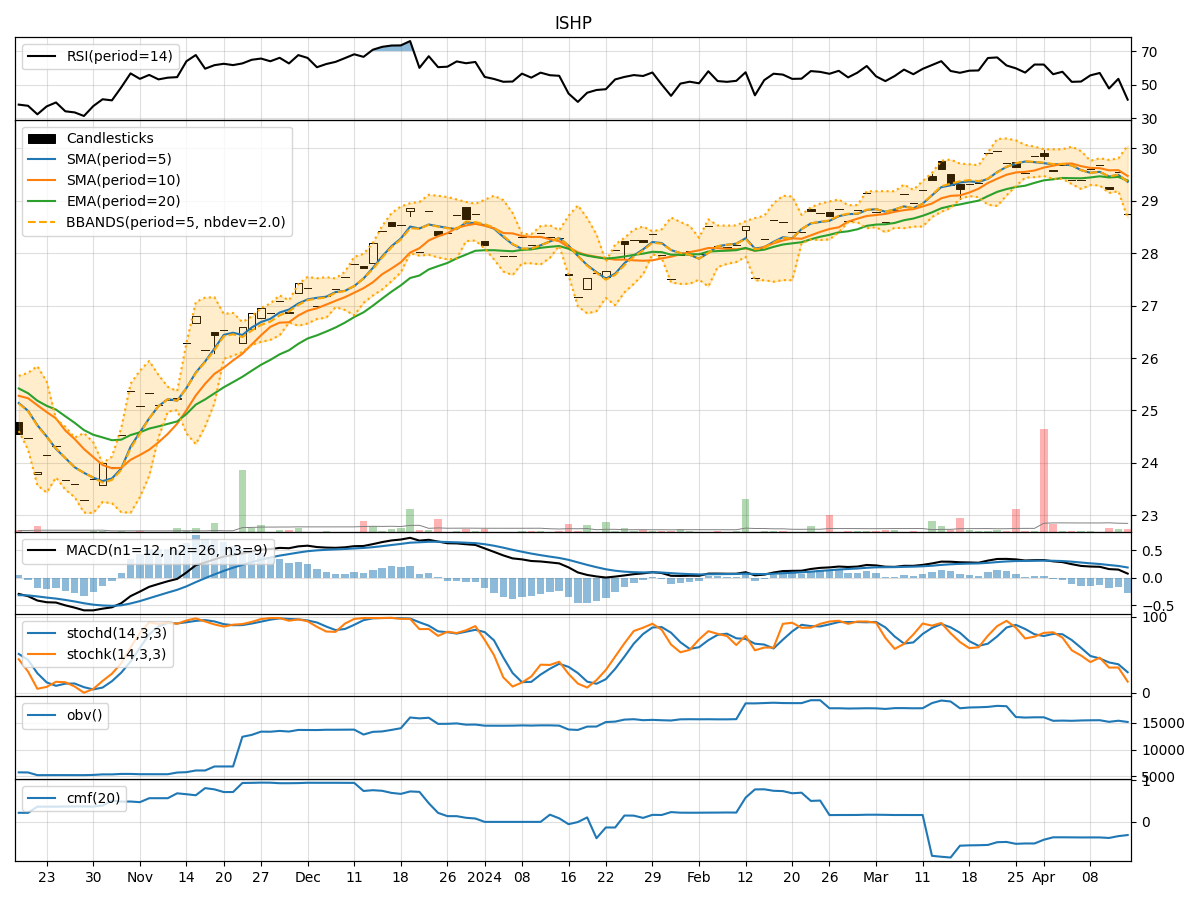
- Moving Averages (MA): The 5-day Moving Average (MA) has been consistently above the Simple Moving Average (SMA) and Exponential Moving Average (EMA), indicating a bullish trend.
- MACD: The MACD line has been above the signal line, with both lines showing an upward trend, suggesting bullish momentum.
Momentum Analysis:
- RSI: The Relative Strength Index (RSI) has been fluctuating around the 60-70 range, indicating a neutral momentum.
- Stochastic Oscillator: The Stochastic Oscillator has been in the overbought zone, suggesting a potential reversal or consolidation.
Volatility Analysis:
- Bollinger Bands (BB): The stock price has been trading within the Bollinger Bands, with the bands narrowing, indicating decreasing volatility.
Volume Analysis:
- On-Balance Volume (OBV): The OBV has shown a slight decline, indicating some selling pressure.
- Chaikin Money Flow (CMF): The CMF has been negative, suggesting a bearish sentiment in the market.
Key Observations:
- The trend indicators suggest a bullish outlook, supported by the MACD.
- Momentum indicators show a neutral to slightly overbought condition, indicating a potential consolidation phase.
- Volatility has been decreasing, signaling a possible period of price stabilization.
- Volume indicators point towards some selling pressure and bearish sentiment in the market.
Conclusion:
Based on the analysis of the technical indicators, the stock price of ISHP is likely to experience sideways movement or consolidation in the next few days. The bullish trend indicated by moving averages and MACD may be offset by the neutral to slightly overbought momentum and bearish sentiment in volume indicators. Traders should exercise caution and monitor for potential reversals or breakout opportunities.