Technical Analysis of ISTB 2024-05-10
Overview:
In analyzing the technical indicators for ISTB over the last 5 days, we will delve into the trend, momentum, volatility, and volume indicators to provide a comprehensive outlook on the possible stock price movement in the coming days. By examining these key indicators, we aim to offer valuable insights and predictions for informed decision-making.
Trend Analysis:
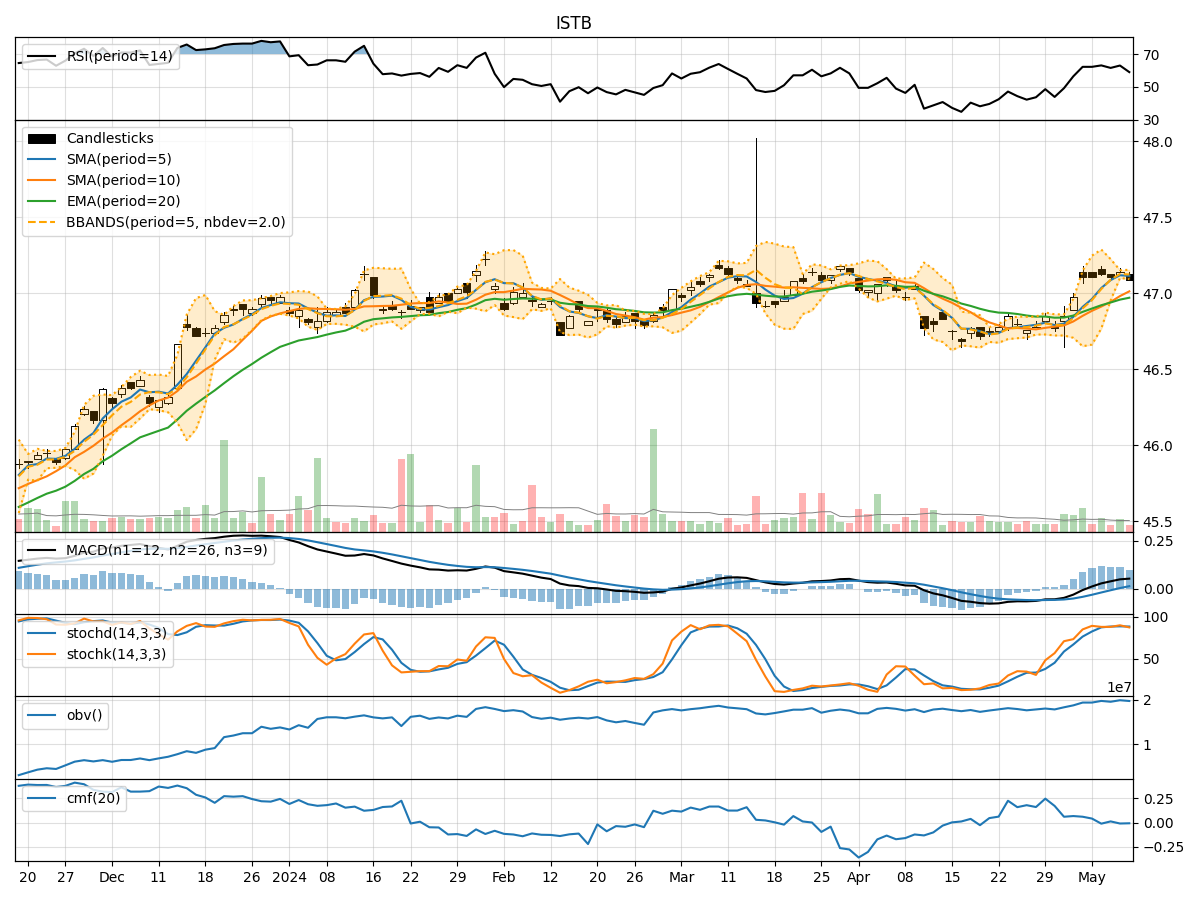
- Moving Averages (MA): The 5-day Moving Average (MA) has been relatively stable around the current price, indicating a neutral trend.
- MACD: The Moving Average Convergence Divergence (MACD) shows a slight positive momentum, with the MACD line crossing above the signal line in recent days.
- RSI: The Relative Strength Index (RSI) is in the neutral zone, suggesting a balanced momentum in the stock.
Momentum Analysis:
- Stochastic Oscillator: The Stochastic Oscillator indicates that the stock is neither overbought nor oversold, reflecting a neutral momentum.
- Williams %R: The Williams %R also suggests a neutral momentum, hovering around the midpoint.
Volatility Analysis:
- Bollinger Bands (BB): The Bollinger Bands show a narrowing of the bands, indicating decreasing volatility and a potential period of consolidation.
- Average True Range (ATR): The ATR is relatively low, suggesting a lack of significant price movements.
Volume Analysis:
- On-Balance Volume (OBV): The OBV has been relatively stable, indicating a balance between buying and selling pressure.
- Chaikin Money Flow (CMF): The CMF is slightly negative, suggesting some selling pressure in the stock.
Key Observations:
- The stock is currently in a consolidation phase, with indicators pointing towards a lack of clear direction in price movement.
- The neutral to slightly positive momentum suggests a balanced market sentiment.
- Volatility is decreasing, indicating a potential period of stability in the stock price.
- The volume indicators show a balance between buying and selling pressure.
Conclusion:
Based on the analysis of the technical indicators, the stock is likely to continue trading sideways in the near term. The lack of significant trends in the indicators, coupled with decreasing volatility, suggests a period of consolidation. Investors may expect the stock price to remain range-bound with limited upside or downside potential. It is advisable to closely monitor any breakout or significant changes in the technical indicators for potential trading opportunities.