Technical Analysis of ISWN 2024-05-10
Overview:
In analyzing the technical indicators for ISWN stock over the last 5 days, we will delve into the trend, momentum, volatility, and volume indicators to provide a comprehensive outlook on the possible stock price movement in the coming days. By examining these key aspects, we aim to offer valuable insights and predictions to guide your investment decisions.
Trend Analysis:
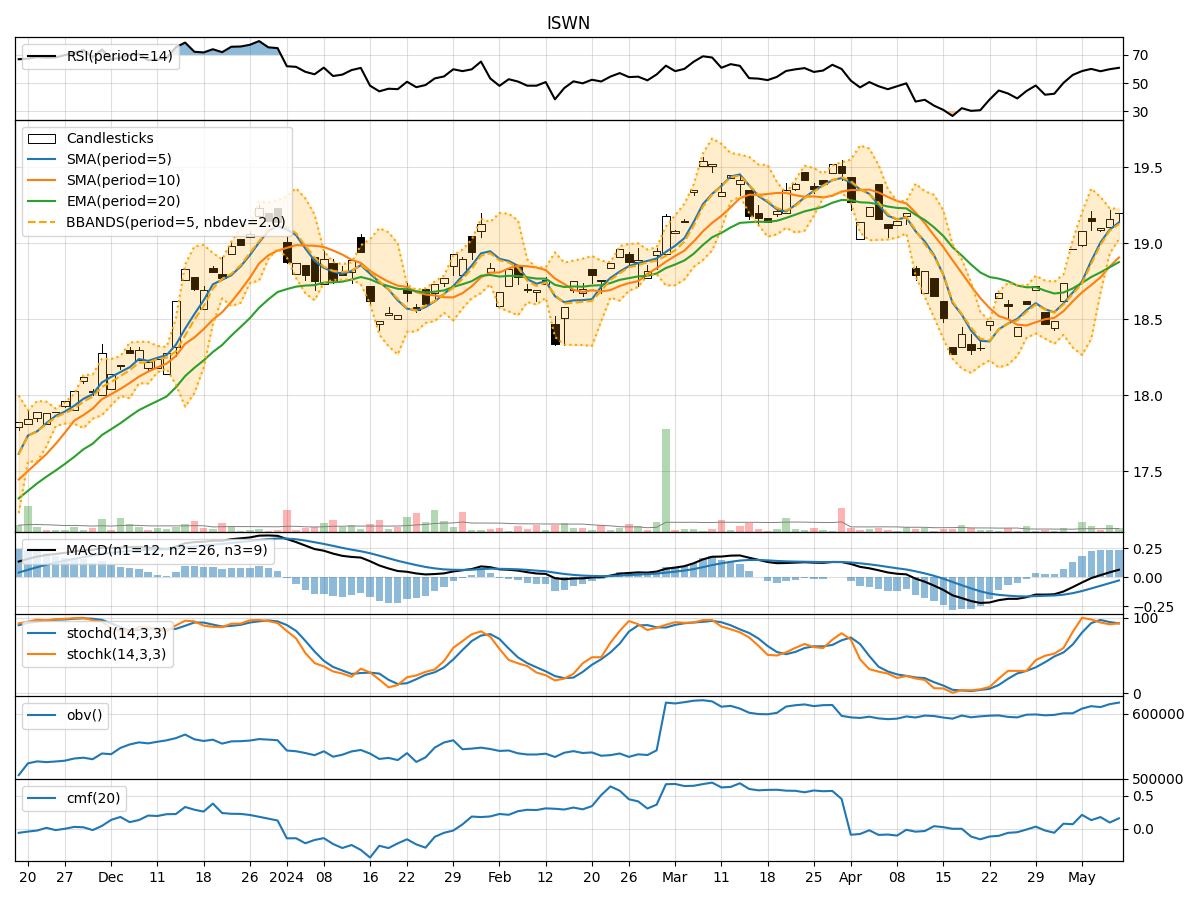
- Moving Averages (MA): The 5-day Moving Average (MA) has been consistently above the Simple Moving Average (SMA) and Exponential Moving Average (EMA), indicating a bullish trend.
- MACD: The MACD line has been consistently above the signal line, with the MACD Histogram showing an increasing positive value, suggesting bullish momentum.
Momentum Analysis:
- RSI: The Relative Strength Index (RSI) has been hovering around 60-61, indicating a neutral to slightly bullish momentum.
- Stochastic Oscillator: Both %K and %D lines of the Stochastic Oscillator have been above 80, signaling overbought conditions.
Volatility Analysis:
- Bollinger Bands (BB): The stock price has been trading within the upper Bollinger Band (BBU), indicating an uptrend with increased volatility.
- Bollinger %B (BBP): The %B value has been consistently above 0.5, suggesting an upward momentum.
Volume Analysis:
- On-Balance Volume (OBV): The OBV has shown a slight increase over the last 5 days, indicating accumulation by investors.
- Chaikin Money Flow (CMF): The CMF has been positive but fluctuating, reflecting mixed buying pressure.
Key Observations and Opinions:
- Trend: The trend indicators suggest a strong bullish sentiment in the short term.
- Momentum: The momentum indicators show a slightly overbought condition, which may lead to a temporary pullback.
- Volatility: The volatility indicators point towards an uptrend with increased price fluctuations.
- Volume: The volume indicators indicate moderate buying interest but lack strong confirmation of sustained accumulation.
Conclusion:
Based on the analysis of the technical indicators, the next few days for ISWN stock are likely to see continued upward movement with potential for short-term consolidation due to overbought conditions. Investors should closely monitor the price action for any signs of reversal or correction. Overall, the outlook remains bullish in the near term, but caution is advised given the current market dynamics.