Technical Analysis of ITA 2024-05-10
Overview:
In analyzing the provided technical indicators for the last 5 days, we will delve into the trend, momentum, volatility, and volume indicators to forecast the possible stock price movement for the next few days. By examining these key aspects, we aim to provide a comprehensive and insightful prediction backed by data-driven analysis.
Trend Analysis:
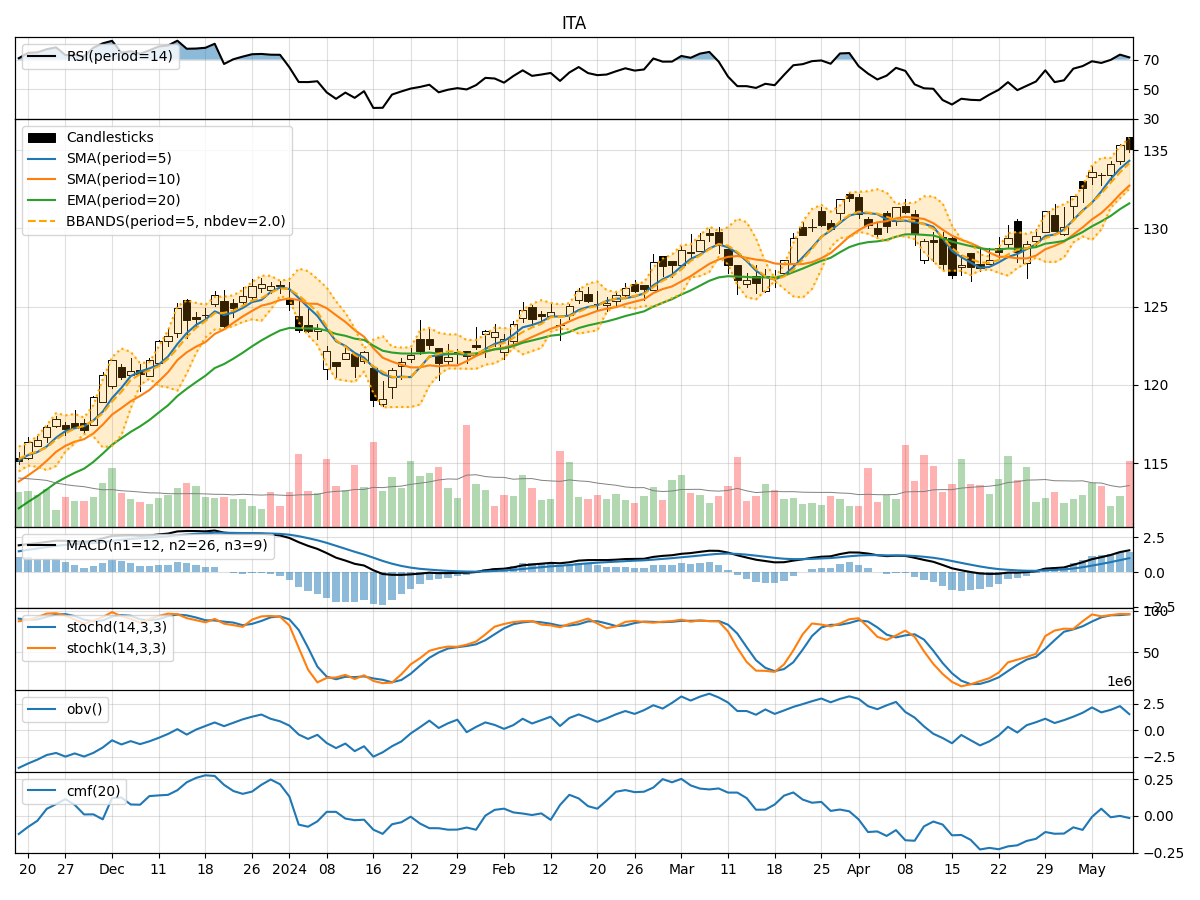
- Moving Averages (MA): The moving averages have been showing an upward trend, with the 5-day MA consistently above the longer-term SMAs and EMAs. This indicates a bullish momentum in the stock price.
- MACD: The MACD line has been consistently above the signal line, with both lines showing an upward trajectory. This suggests a strengthening bullish trend in the stock.
- RSI: The RSI values have been relatively high, indicating that the stock may be overbought. However, the RSI alone may not be a reliable indicator for predicting price movements.
Momentum Analysis:
- Stochastic Oscillator: The stochastic oscillator values have been in the overbought territory, suggesting a potential reversal or a period of consolidation in the stock price.
- Williams %R: The Williams %R values have also been in the oversold region, indicating a possible reversal in the stock price.
Volatility Analysis:
- Bollinger Bands: The Bollinger Bands have been relatively narrow, indicating low volatility in the stock price. This could suggest a period of consolidation or a potential breakout in the near future.
Volume Analysis:
- On-Balance Volume (OBV): The OBV values have been fluctuating, indicating mixed sentiment among investors regarding the stock.
- Chaikin Money Flow (CMF): The CMF values have been close to zero, suggesting a balance between buying and selling pressure in the stock.
Key Observations:
- The trend indicators point towards a bullish sentiment in the stock, supported by the MACD and moving averages.
- Momentum indicators, such as the stochastic oscillator and Williams %R, suggest a potential reversal or consolidation in the stock price.
- Volatility indicators indicate low volatility, which could lead to a breakout or a period of consolidation.
- Volume indicators show mixed sentiment among investors, with no clear direction in terms of buying or selling pressure.
Conclusion:
Based on the analysis of the technical indicators, the stock is likely to experience sideways movement or consolidation in the next few days. While the trend indicators signal a bullish sentiment, the momentum indicators suggest a potential reversal or consolidation. The low volatility and mixed volume indicators further support the view of sideways movement. It is advisable to closely monitor the price action and key support/resistance levels for any potential breakout or trend reversal.