Technical Analysis of ITDA 2024-05-10
Overview:
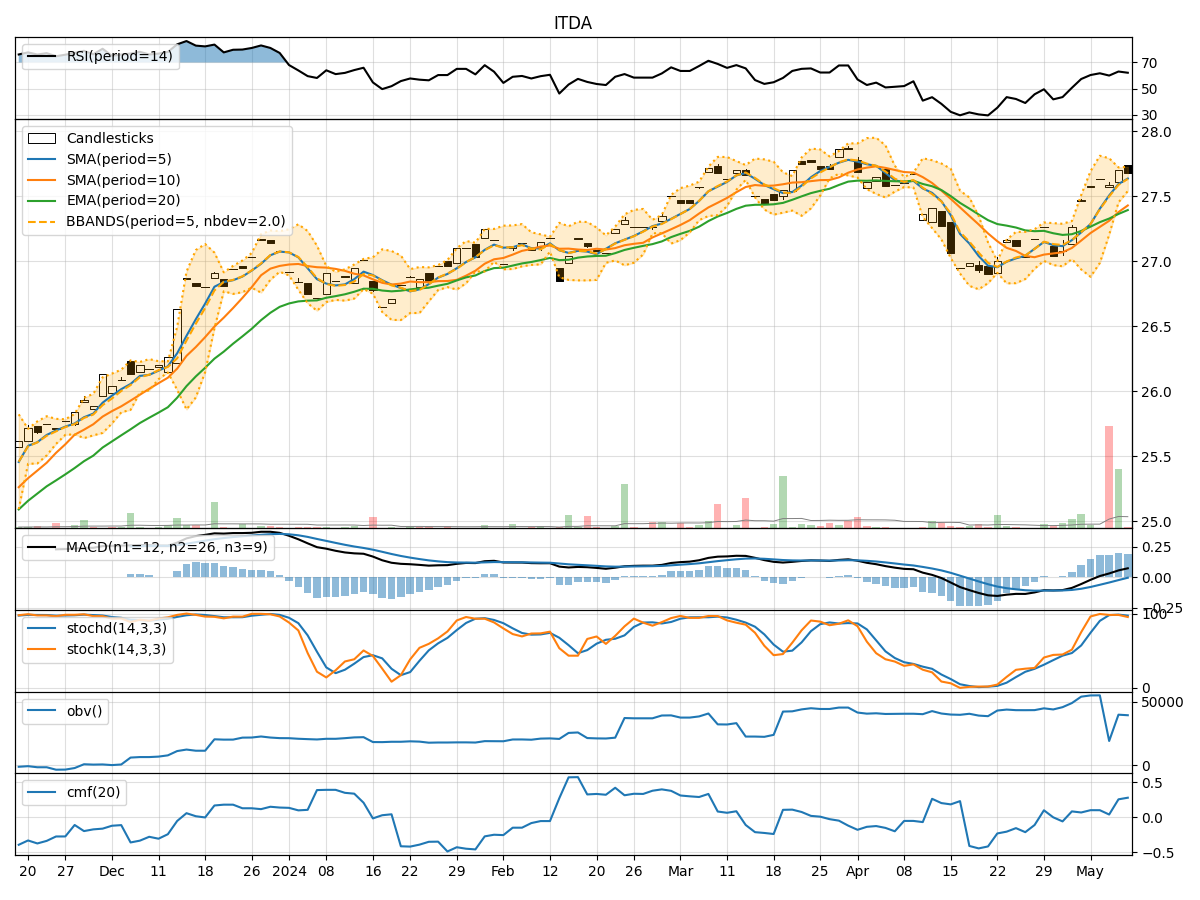
In the last 5 trading days, the stock has shown a relatively stable performance with minor fluctuations in price and volume. The technical indicators provide insights into the trend, momentum, volatility, and volume of the stock. By analyzing these indicators, we can make informed predictions about the possible future movements of the stock price.
Trend Analysis:
- Moving Averages (MA): The 5-day Moving Average (MA) has been consistently above the Simple Moving Average (SMA) and Exponential Moving Average (EMA), indicating a short-term uptrend in the stock price.
- MACD: The MACD line has been consistently above the signal line, with both lines showing an upward trend. This suggests a bullish momentum in the stock.
Momentum Analysis:
- RSI: The Relative Strength Index (RSI) has been fluctuating around the overbought territory, indicating a strong buying momentum in the stock.
- Stochastic Oscillator: Both %K and %D lines of the Stochastic Oscillator have been in the overbought zone, suggesting a potential reversal or consolidation in the stock price.
Volatility Analysis:
- Bollinger Bands (BB): The stock price has been trading within the Bollinger Bands, with the bands narrowing down. This indicates decreasing volatility and a possible period of consolidation.
Volume Analysis:
- On-Balance Volume (OBV): The OBV has shown mixed signals, with some days seeing positive volume accumulation and others showing distribution. This indicates indecision among investors regarding the stock.
- Chaikin Money Flow (CMF): The CMF has been positive, indicating that money is flowing into the stock. However, the magnitude of the flow is not significant.
Key Observations:
- The stock is currently in an upward trend based on moving averages and MACD.
- Momentum indicators suggest a strong buying momentum but also indicate an overbought condition.
- Volatility is decreasing, pointing towards a possible period of consolidation.
- Volume indicators show mixed signals, reflecting investor indecision.
Conclusion:
Based on the analysis of technical indicators, the next few days' possible stock price movement is likely to be sideways or consolidating with a slight upward bias. The stock may experience a period of consolidation as volatility decreases, but the overall trend remains bullish. Investors should monitor the stock closely for any signs of a breakout or reversal in the coming days.