Technical Analysis of ITDC 2024-05-10
Overview:
In analyzing the technical indicators for ITDC over the last 5 days, we will delve into the trend, momentum, volatility, and volume indicators to provide a comprehensive outlook on the possible stock price movement in the coming days. By examining these key aspects, we aim to offer valuable insights and recommendations for potential investors.
Trend Analysis:
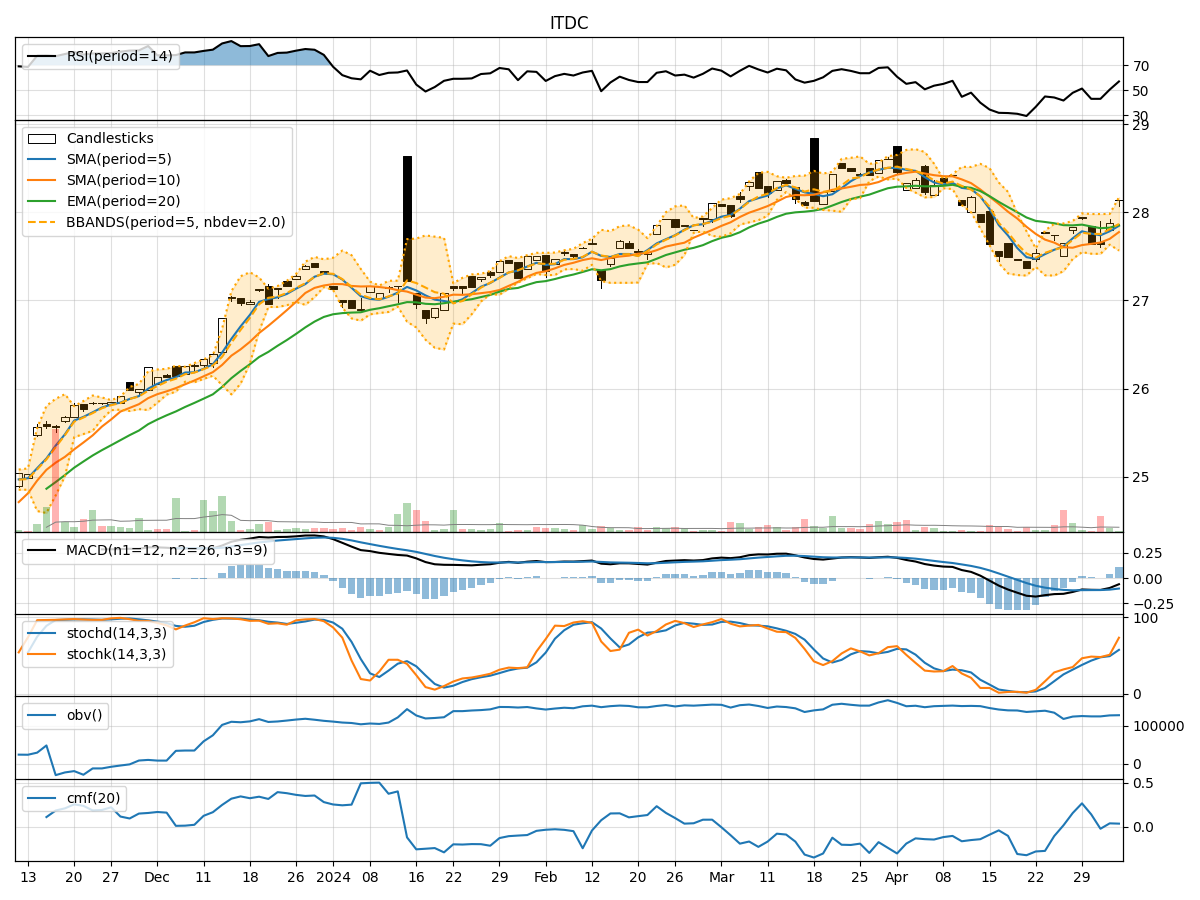
- Moving Averages (MA): The 5-day Moving Average (MA) has been consistently above the Simple Moving Average (SMA) and Exponential Moving Average (EMA), indicating a bullish trend.
- MACD: The MACD line has been consistently above the signal line, suggesting a bullish momentum in the stock price.
- MACD Histogram: The MACD Histogram has been mostly positive, further supporting the bullish sentiment in the stock.
Momentum Analysis:
- RSI: The Relative Strength Index (RSI) has been in the neutral to slightly overbought territory, indicating a balanced momentum in the stock.
- Stochastic Oscillator: Both %K and %D lines of the Stochastic Oscillator have been fluctuating in the overbought region, suggesting a potential reversal or consolidation.
Volatility Analysis:
- Bollinger Bands (BB): The stock price has mostly remained within the Bollinger Bands, with the bands narrowing, indicating decreasing volatility.
- Bollinger %B: The %B indicator has been hovering around the middle range, signifying a neutral stance in terms of volatility.
Volume Analysis:
- On-Balance Volume (OBV): The OBV has shown mixed signals with fluctuations, indicating indecision among investors.
- Chaikin Money Flow (CMF): The CMF has been positive, suggesting a potential inflow of money into the stock.
Key Observations:
- The trend indicators suggest a strong bullish sentiment in the stock price.
- Momentum indicators show a slightly overbought condition, hinting at a possible consolidation or reversal.
- Volatility has been decreasing, indicating a period of stability in the stock price.
- Volume indicators reflect mixed signals, with no clear direction in investor sentiment.
Conclusion:
Based on the analysis of the technical indicators, the stock price of ITDC is likely to experience further upward movement in the coming days. However, given the slightly overbought momentum and mixed volume signals, there might be a short-term consolidation before resuming the upward trend. Investors should closely monitor the price action for potential entry or exit points, considering the overall bullish outlook with caution for potential reversals.