Technical Analysis of ITDG 2024-05-10
Overview:
In analyzing the technical indicators for ITDG over the last 5 days, we will delve into the trend, momentum, volatility, and volume indicators to provide a comprehensive outlook on the possible stock price movement in the coming days. By examining these key aspects, we aim to offer valuable insights and predictions for potential investors.
Trend Indicators:
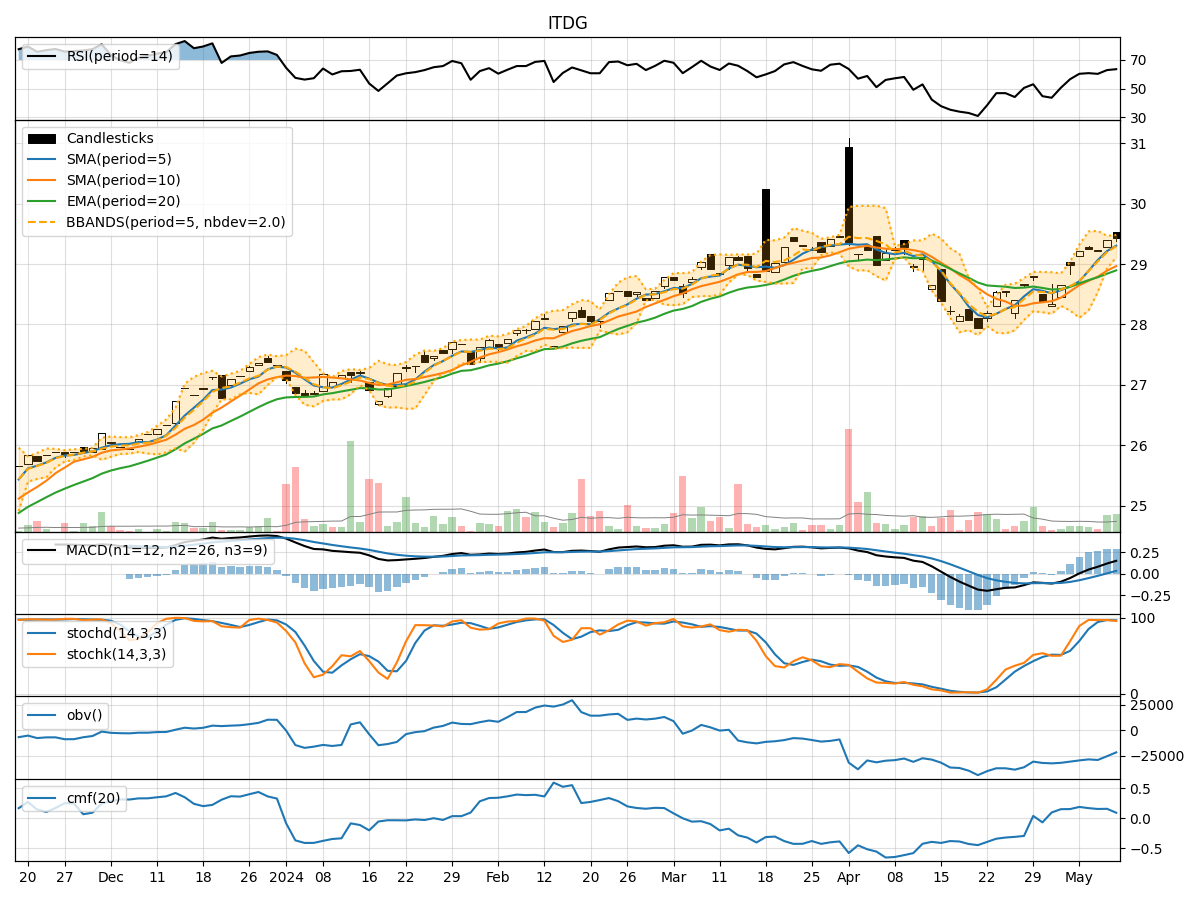
- Moving Averages (MA): The 5-day MA has been consistently above the 10-day SMA, indicating a short-term bullish trend. The EMA(20) has been steadily increasing, reflecting positive momentum.
- MACD: The MACD line has been above the signal line for the past 5 days, suggesting bullish momentum.
- Conclusion: The trend indicators point towards a bullish outlook for ITDG in the near term.
Momentum Indicators:
- RSI: The RSI has been in the range of 60-64, indicating a balanced momentum without extreme overbought or oversold conditions.
- Stochastic Oscillator: Both %K and %D have been relatively high, suggesting strong buying pressure.
- Conclusion: Momentum indicators support a bullish sentiment for ITDG.
Volatility Indicators:
- Bollinger Bands (BB): The stock price has been trading within the upper Bollinger Band, indicating an uptrend with increased volatility.
- Conclusion: Volatility indicators suggest a bullish trend with potential price expansion.
Volume Indicators:
- On-Balance Volume (OBV): The OBV has been negative, indicating distribution of shares.
- Chaikin Money Flow (CMF): The CMF has been positive but decreasing, signaling weakening buying pressure.
- Conclusion: Volume indicators show mixed signals, with OBV indicating a bearish sentiment while CMF suggests a potential sideways movement.
Overall Conclusion:
Based on the analysis of trend, momentum, volatility, and volume indicators, the overall outlook for ITDG in the next few days leans towards a bullish trend. The positive trend and momentum indicators, coupled with increased volatility, indicate a potential for further price appreciation. However, the conflicting signals from volume indicators, particularly the OBV, suggest a degree of caution as there might be some distribution happening despite the positive price action.
Recommendation:
Considering the overall bullish sentiment in the technical indicators, investors may consider buying ITDG in the short term. However, it is essential to monitor the volume indicators closely for any signs of a trend reversal or consolidation. Additionally, incorporating fundamental analysis alongside technical analysis can provide a more holistic view before making investment decisions.