Technical Analysis of ITDH 2024-05-10
Overview:
In analyzing the technical indicators for ITDH stock over the last 5 days, we will delve into the trend, momentum, volatility, and volume indicators to provide a comprehensive outlook on the possible stock price movement in the coming days. By examining these key indicators, we aim to offer valuable insights and predictions for potential investors.
Trend Indicators:
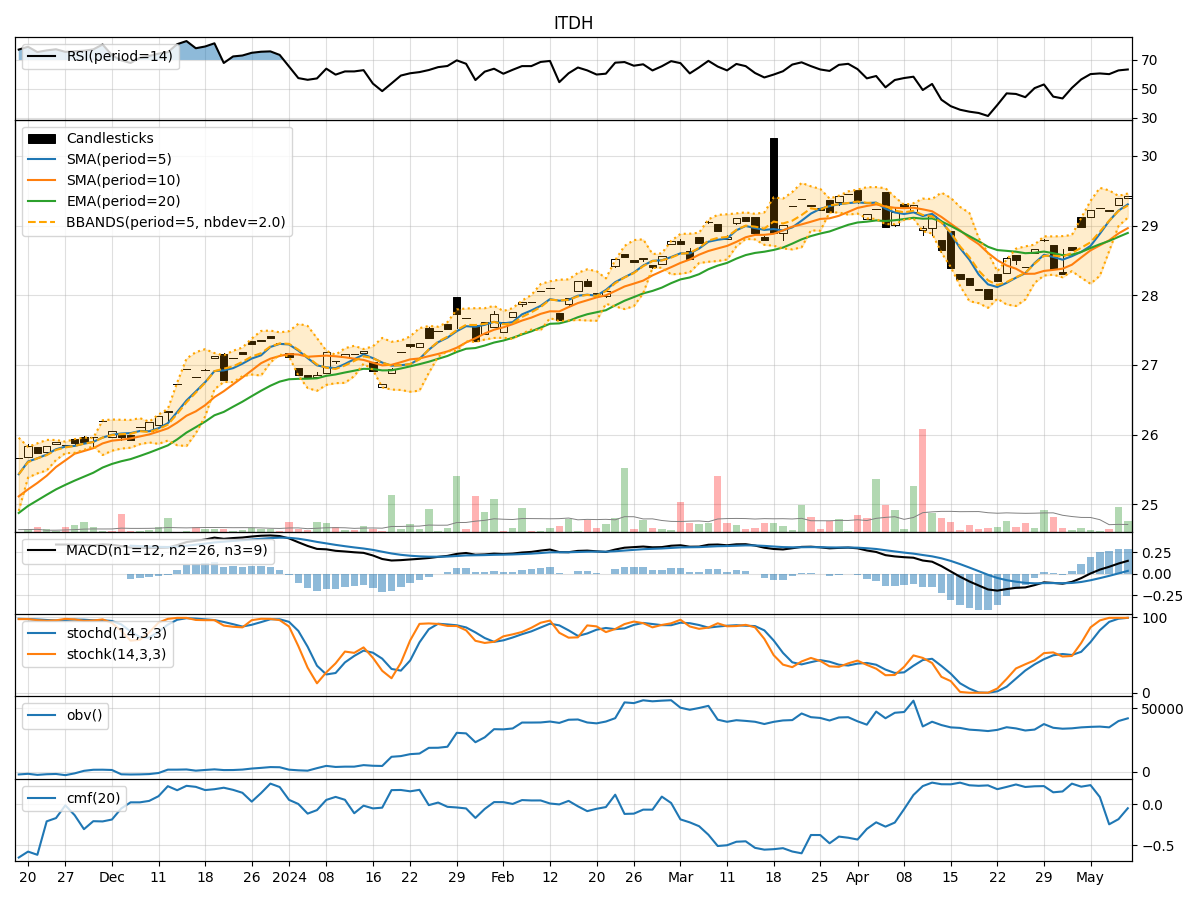
- Moving Averages (MA): The 5-day Moving Average (MA) has been consistently above the Simple Moving Average (SMA) and Exponential Moving Average (EMA), indicating a bullish trend.
- MACD: The MACD line has been consistently above the signal line, suggesting a bullish momentum in the stock price.
- MACD Histogram: The MACD Histogram has been increasing over the past few days, indicating strengthening bullish momentum.
Momentum Indicators:
- RSI: The Relative Strength Index (RSI) has been in the overbought territory, indicating a strong bullish momentum.
- Stochastic Oscillator: Both %K and %D lines of the Stochastic Oscillator have been in the overbought zone, signaling a strong bullish sentiment.
- Williams %R: The Williams %R has been hovering around the oversold region, suggesting a potential reversal in the stock price.
Volatility Indicators:
- Bollinger Bands: The Bollinger Bands have been narrowing, indicating decreasing volatility in the stock price.
- Bollinger %B: The %B indicator has been gradually increasing, suggesting a potential bullish breakout.
- Average True Range (ATR): The ATR has been relatively stable, indicating consistent price movements.
Volume Indicators:
- On-Balance Volume (OBV): The OBV has shown mixed signals with fluctuations, indicating indecision among investors.
- Chaikin Money Flow (CMF): The CMF has been negative, suggesting a bearish sentiment in the stock.
Conclusion:
Based on the analysis of the technical indicators, the stock of ITDH is currently exhibiting strong bullish signals across trend and momentum indicators. The narrowing Bollinger Bands and stable ATR indicate a potential breakout in the stock price. However, the mixed signals from volume indicators like OBV and CMF suggest some uncertainty in investor sentiment.
Forecast:
Considering the overall bullish trend and momentum, it is likely that the stock price of ITDH will continue its upward trajectory in the coming days. Traders may consider entering long positions to capitalize on the potential bullish momentum. However, it is essential to monitor the volume indicators closely for any shifts in investor sentiment that could impact the price movement.
In conclusion, the technical analysis points towards a bullish outlook for ITDH stock in the near term, with the potential for further price appreciation. Investors should conduct further research and risk assessment before making any investment decisions.